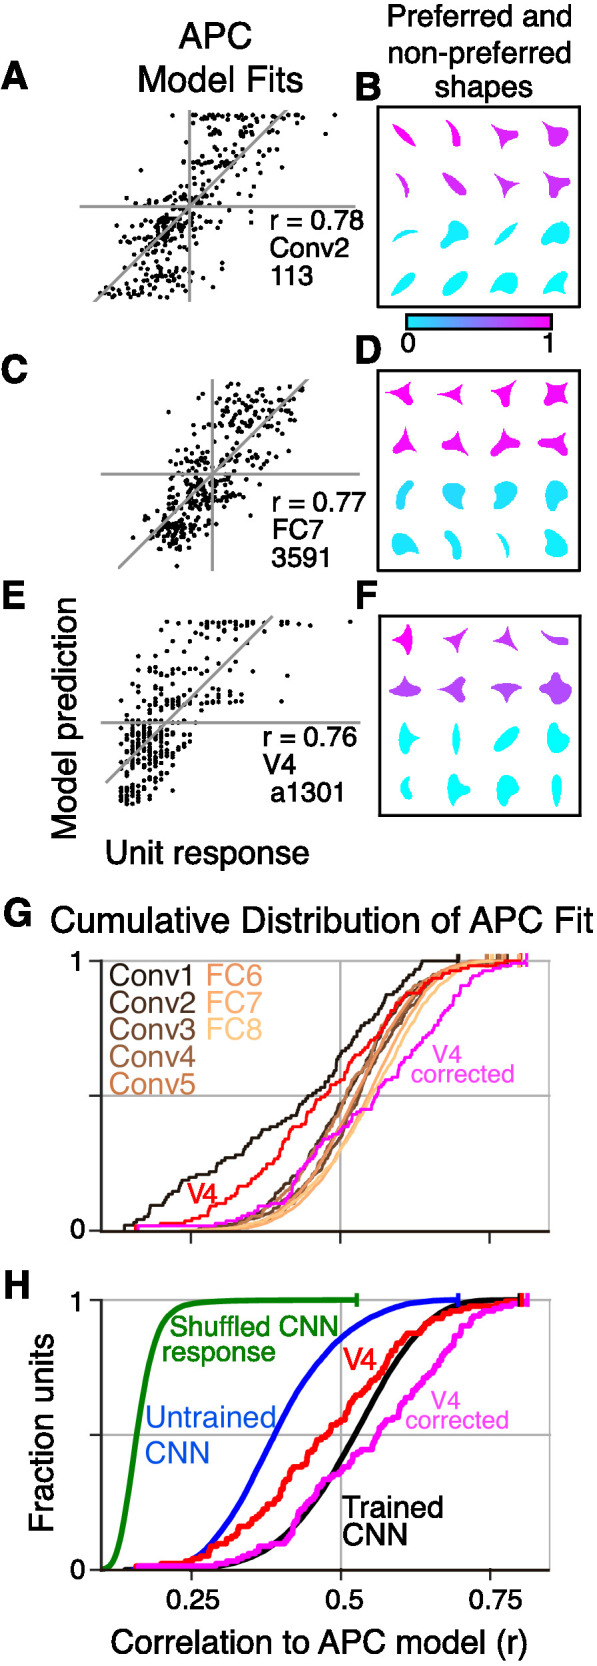
Figure 5. Boundary curvature selectivity for CNN units compared to V4 neurons.

(A) APC model prediction vs. CNN unit response for an example CNN unit from an early layer (Conv2-113). (B) The top and bottom eight shapes sorted by response amplitude (most preferred shape is at upper left, least at lower right) reveal a preference for convexity to the upper left (such a feature is absent in the non-preferred shapes). This is consistent with the APC fit parameters, , , °, °. (C) Predicted vs. measured responses for another well-fit example CNN unit (FC7-3591) but in a later layer. (D) Top and bottom eight shapes for example unit in (C). The APC model fit was , , °, °. (E) Model prediction vs. neuronal mean firing rate (normalized) for the V4 neuron (a1301) that had the highest APC fit r-value. (F) The top eight shapes (purple) all have a strong convexity to the left, whereas the bottom eight (cyan) do not. The APC model fit was , , °, °. (G) The cumulative distributions (across units) of APC r-values are plotted for the first sublayer of each major CNN layer (boldface names in Figure 2C) from Conv1 (black) to FC8 (lightest orange). The other sublayers (distributions not shown for clarity) tended to have lower APC r-values but the trend for increasing APC r-value with layer was similar. For comparison, red line shows cumulative distribution for 109 V4 neurons (Pasupathy and Connor, 2001), and pink line shows V4 distribution corrected for noise (see Materials and methods). (H) The cumulative distribution of r-values for the APC fits for all CNN units (black), CNN units with shuffled responses (green), units in an untrained CNN (blue) and V4 (red and pink). The far leftward shift of the green line shows that fit quality deteriorates substantially when the responses are shuffled across the 362 stimuli within each unit.
