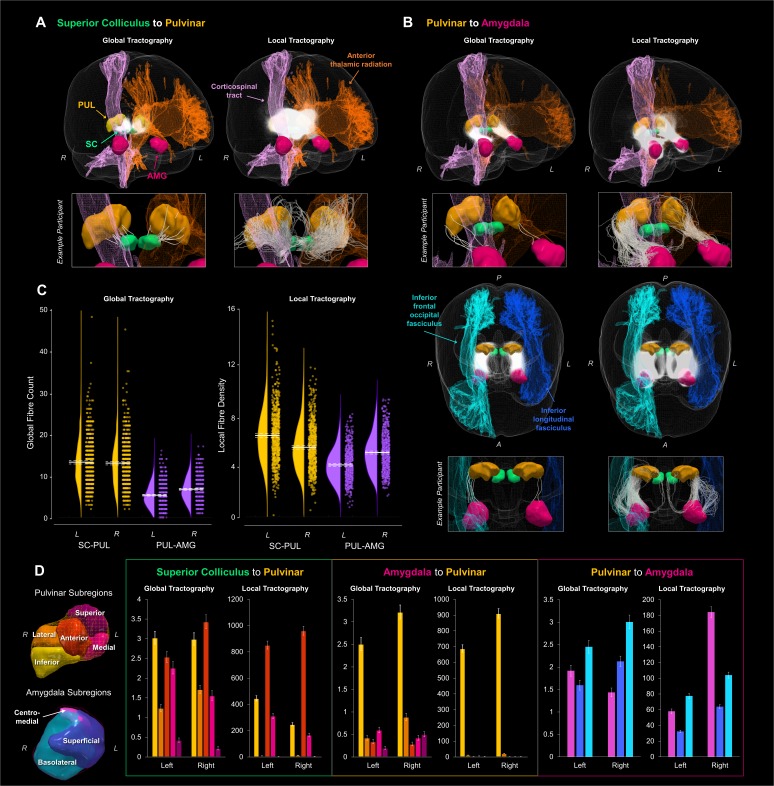
Figure 1. Global and local probabilistic tractography reconstructions of the subcortical route to the amygdala.
Fibres reconstructed between the superior colliculus and the pulvinar are shown in (A) and between the pulvinar and amygdala in (B). Both (A) and the top row of (B) show 3D-renders of the major ROIs (amygdala in pink, pulvinar in orange, superior colliculus in green), as well as the left anterior thalamic radiation (orange) and the right corticospinal tract (pink). The reconstructed fibres for all participants are rendered by semi-transparent white streamlines. Streamlines of a single example participant are shown below in boxes. The bottom half of (B) shows a different, top-down perspective of the pulvinar to amygdala pathway, illustrating the right inferior frontal occipital fasciculus (light blue) and the left inferior longitudinal fasciculus (dark blue). (C) shows the global fibre counts (left graph) and average fibre density (right graph) for global and local tractography, respectively (SC-PUL in yellow, PUL-AMG in purple). Group average is indicated by solid white line, with dotted lines indicating the 95% confidence interval. (D) shows the average number of fibres terminating in each subregion of the pulvinar and amygdala, for both global and local tractography. 3D renders of the subregions (colour-coded to match the graphs) are shown on the left. Graphs of the number of fibres terminating in pulvinar subregions are shown for tracts connecting the superior colliculus and pulvinar (first and second graphs) and the pulvinar and amygdala (third and fourth graphs), while fibres terminating in amygdala subregions are shown for tracts connecting the pulvinar and amygdala (fifth and sixth graphs). Error bars represent 95% confidence intervals.

