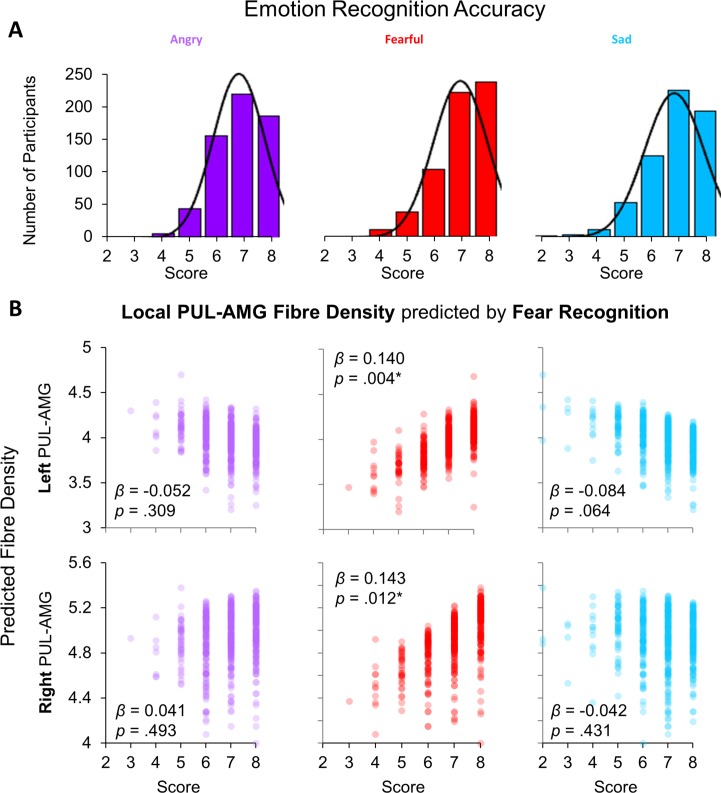
Figure 2. Relationship between behavioural performance and tractography.
(A) Histograms of scores (out of eight) for correctly recognising the emotional expression of angry, fearful, and sad faces from the Penn Recognition Test. Normal distribution function is plotted. (B) The relationships between recognition of angry (purple), fearful (red), and sad (blue) faces (x-axes) and the predicted local fibre densities for the left (top row) and right (bottom row) PUL-AMG connection (y-axes), as produced by a multivariate ANOVA. Fearful face recognition accuracy was significantly related to local fibre density for the left and right PUL-AMG connections (β and p values shown for parameter estimates from multivariate ANOVA, *p < .05).

