
Appendix 1—table 12. Partial correlations between fibre density of each pathway and the corresponding DCM parameter estimate.
Scatterplots show the fibre density (x-axis) residuals (after regressing against head motion) and the DCM parameter estimate (y-axis) residuals (after regressing against head motion). *p<0.05, Bonferroni-corrected
| Global Tractography |
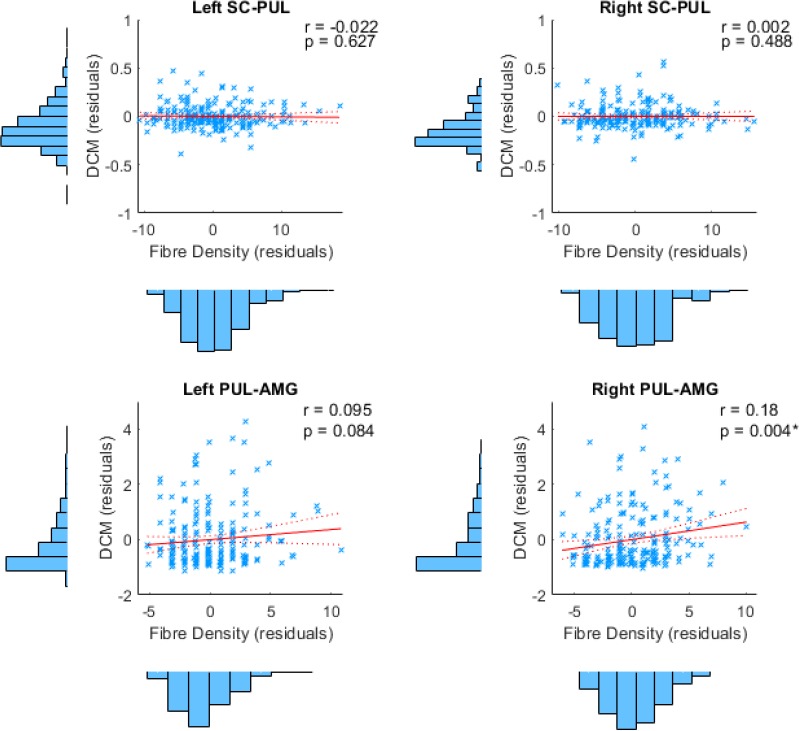 |
| Local Tractography |
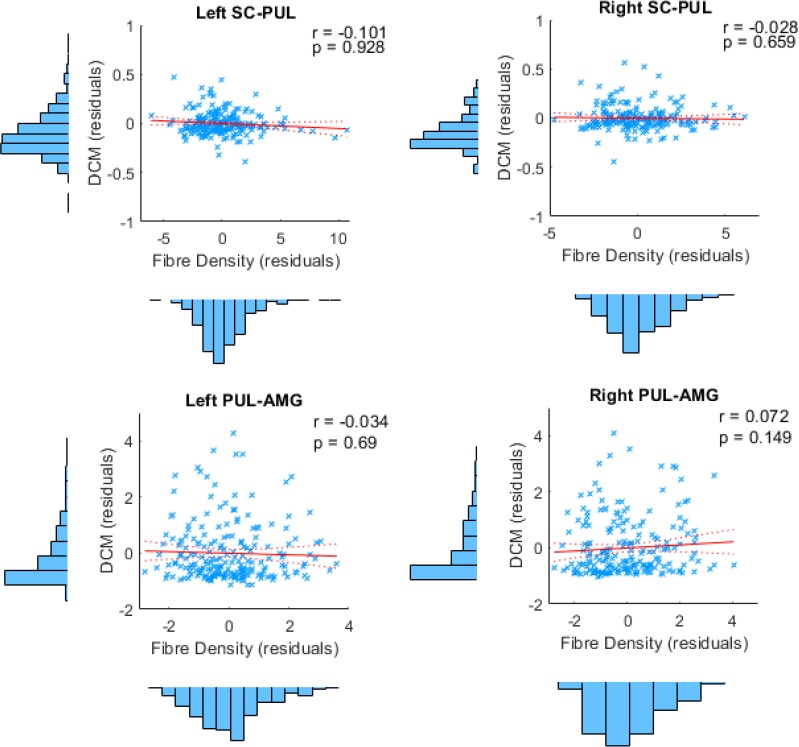 |
| Global Tractography |
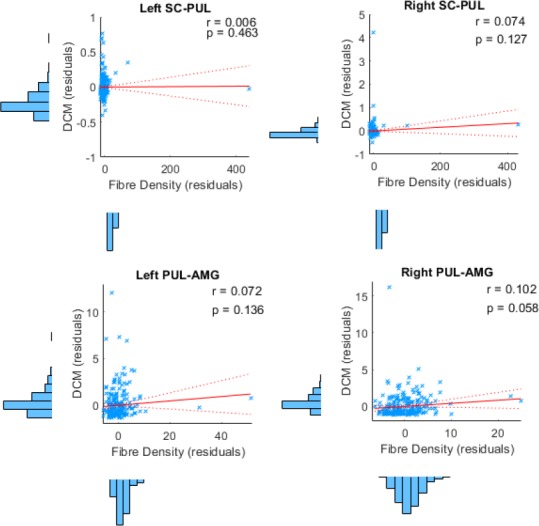 |
| Local Tractography |
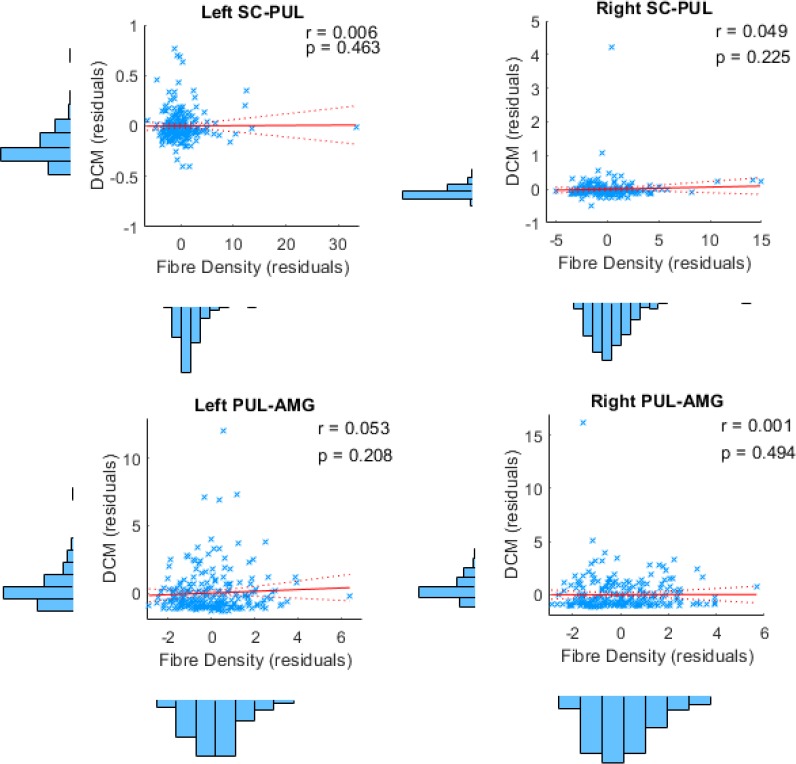 |
Local Tractography.