. 2019 Jan 16;8:e39595. doi: 10.7554/eLife.39595

Figure 2. Fine-mapping shared caQTLs.

(A) Heatmap showing the overlap in caQTLs for every pair of populations (only for variants that were testable in all ten). To avoid issues related to arbitrary p-value cutoffs, we used the shift in p-value distribution, known as π1 (Storey et al., 2004), to assess overlap. (B) Mapping a trait in multiple populations differing in LD structure allows fine-mapping of causal variants, which will show the most consistent associations. (C) caQTLs shared across many populations (at p<5×10⁻⁴) are more highly enriched for experimentally-determined causal eQTL variants (Tewhey et al., 2016). Full results available in Figure 2—source data 1.

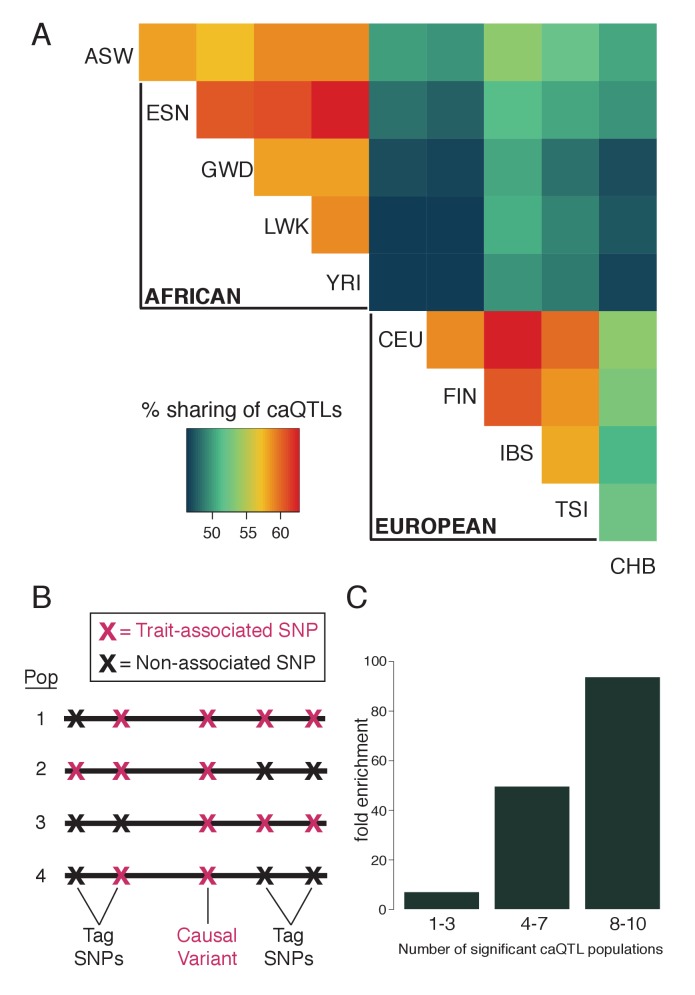
Figure 2—source data 1. All caQTLs testable (at least 20 reads and MAF >0.01) in all ten populations.
DOI: 10.7554/eLife.39595.012

Figure 2.

Figure 2—figure supplement 1. Sharing of caQTLs across populations, as in Figure 2A, but excluding comparisons with divergent allele frequencies.

Figure 2—figure supplement 1.

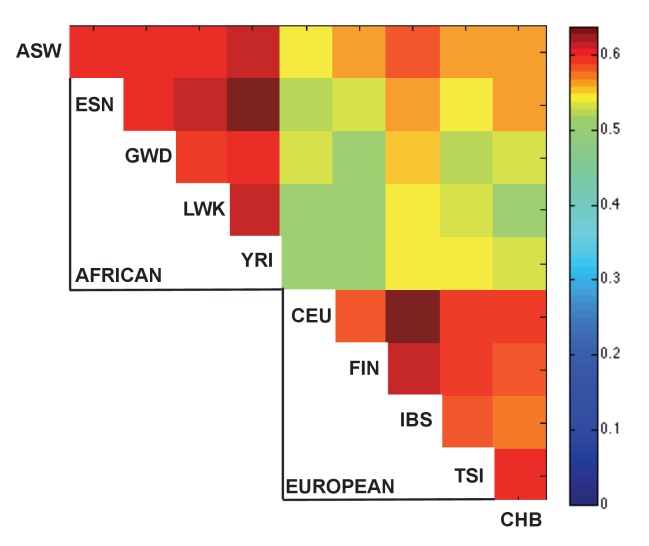
One possible explanation for the increase sharing of caQTLs between closely related population (Figure 2A) is that since the allele frequency can affect power to detect QTLs, more similar allele frequencies could lead to greater levels of sharing. To test this possibility, for each SNP, we calculated the sharing as in Figure 2A after excluding any population that had a pre-ATAC allele frequency >5% away from the mean frequency across all 10 populations. Although this excluded 75% of pairwise comparisons, we still observed a similar pattern of sharing, suggesting that patterns of sharing are unlikely to be driven solely by allele frequency differences.
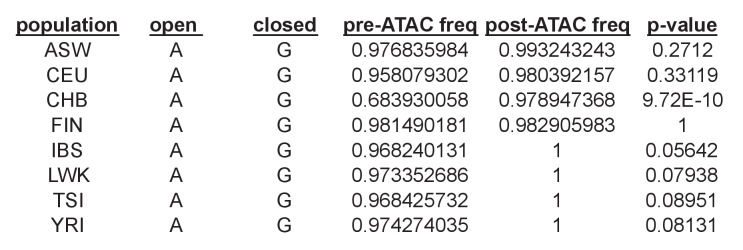
Figure 2—figure supplement 2. Example of a shared caQTL (rs79979970) that is individually significant in only one population (CHB) out of eight tested, but reaches a shared caQTL p=5.6×10⁻⁷ because it has p<0.1 in an additional four populations.

Figure 2—figure supplement 2.

In this case, CHB had the greatest power to detect an effect since it had a pre-ATAC allele frequency of 0.68 for the open allele, whereas the other seven all had frequencies > 0.95 and thus very little range for the open allele to increase in frequency post-ATAC.