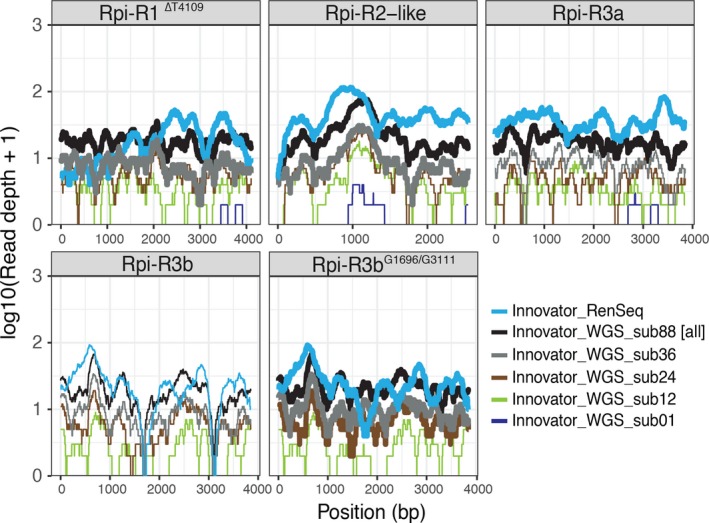
Figure 3.

Comparison between dRenSeq and whole‐genome shotgun sequencing at different sampling depth for the potato variety Innovator. The sequence representation of NLRs identified in Innovator are shown in each box. The x‐axis depicts the coding sequence from start to stop and the y‐axis the read‐coverage on a log scale. Thick horizontal lines indicate full sequence representation without any sequence polymorphisms between the reference and the NLR enriched reads.
