
Figure 1.
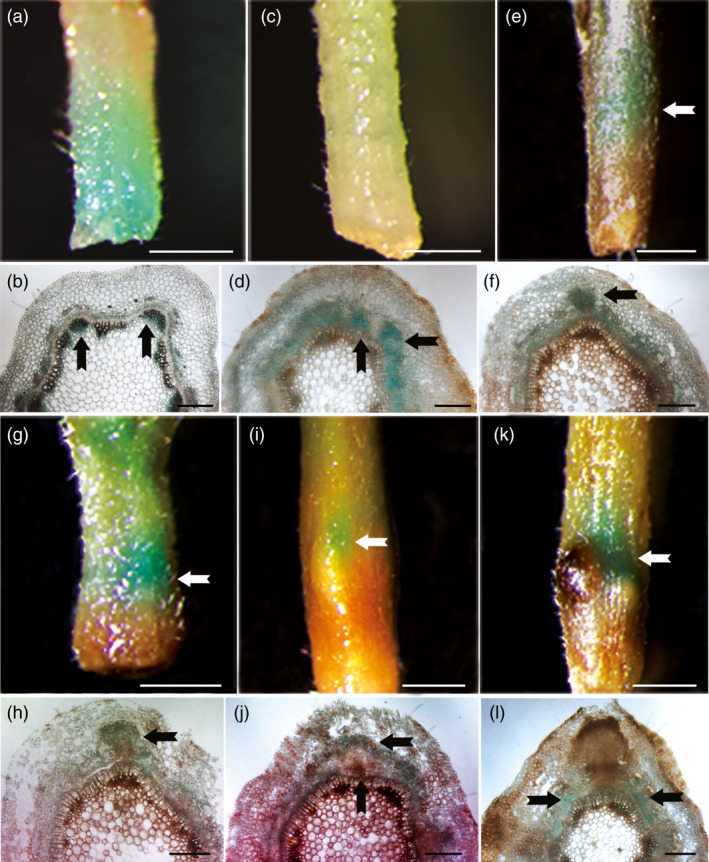
Expression patterns of PagFBL1 during AR formation. GUS staining of Pro Pag FBL 1 ::GUS leafy stems (a, c, e, g, i, k) and their transverse sections (b, d, f, h, j, l); the samples were collected at 0 day (a, b), 2 days (c, d), 3 days (e, f), 4 days (g, h) 5 days (i, j) and 6 days (h, l). Experiments were repeated three times for each, and the representative phenotypes are shown. Scale bars: (a, c, e, g, i, k) 1 mm; (b, d, f, h, j, l) 200 μm.