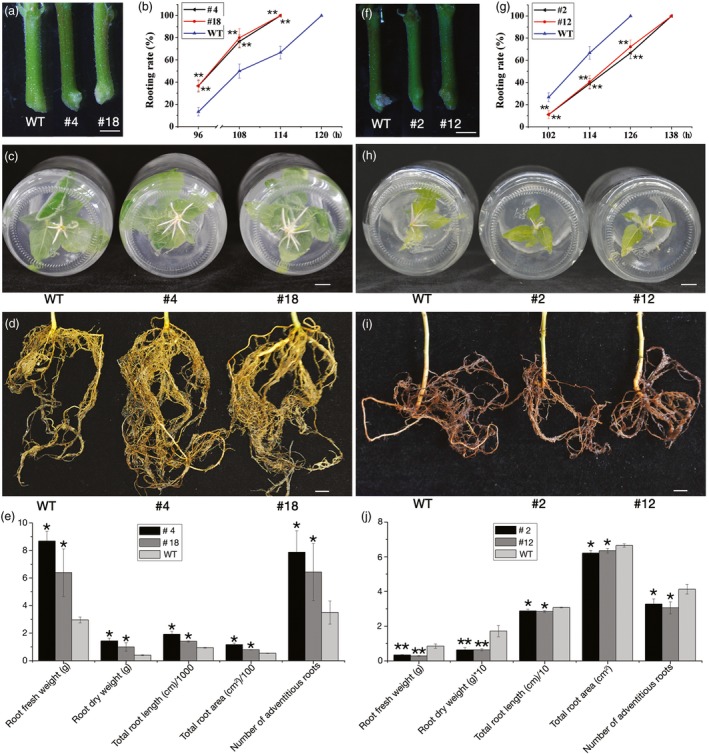
Figure 2.

ARs from leafy stems of PagFBL1 overexpressed lines #4 and #18, knock‐down lines #2 and #12 and WT. (a–e) for #4 and #18: (a) the early stage of ARs. (b) Rooting rates as the percentage of leaf stem explants with emerged ARs. (c) Number of AR induced. (d) AR system from 5 months plants in soils. (e) The quantification of ARs from 5 months plants; (f–g) for #2 and #12: (f) the early stage of ARs. (g) Rooting rates. (h) Number of AR induced. (i) AR system from 2 months plants in soils. (j) The quantification of ARs from 2 months plants. Bars = 1 cm. The values are means ± SE of three replicates. Significant differences between WT and transgenic lines are indicated with asterisks (*P < 0.05 and **P < 0.01).
