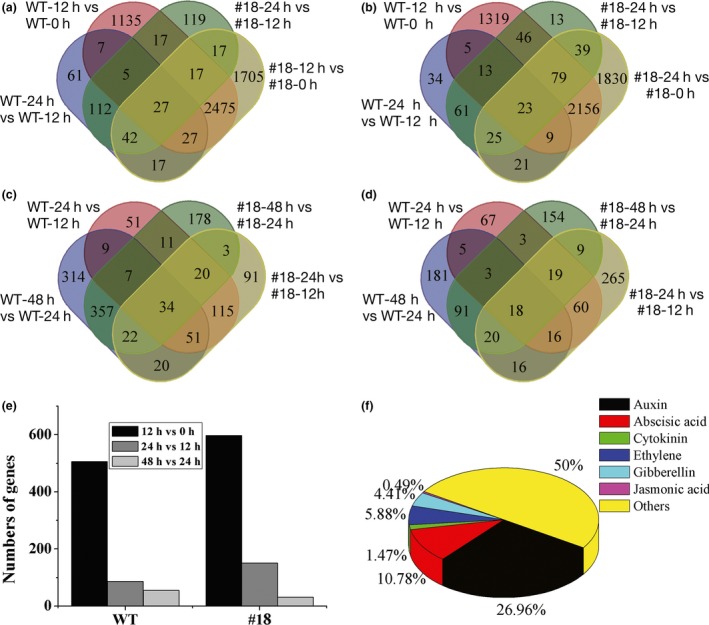
Figure 3.

Venn diagrams showing the number of DEGs classified into groups of 0, 12, 24, 48 h after AR induction. (a) Up‐regulated genes from 12 h vs 0 h and 24 h vs 12 h. (b) Down‐regulated genes from 12 h vs 0 h and 24 h vs 12 h. (c) Up‐regulated genes from 24 h vs 12 h and 48 h vs 24 h. (d) Down‐regulated genes from 24 h vs 12 h and 48 h vs 24 h. (e) COG classification of DEGs in signal transduction mechanisms. (f) DEG percentages for major hormones in plant hormone signal transduction based on KEGG pathway.
