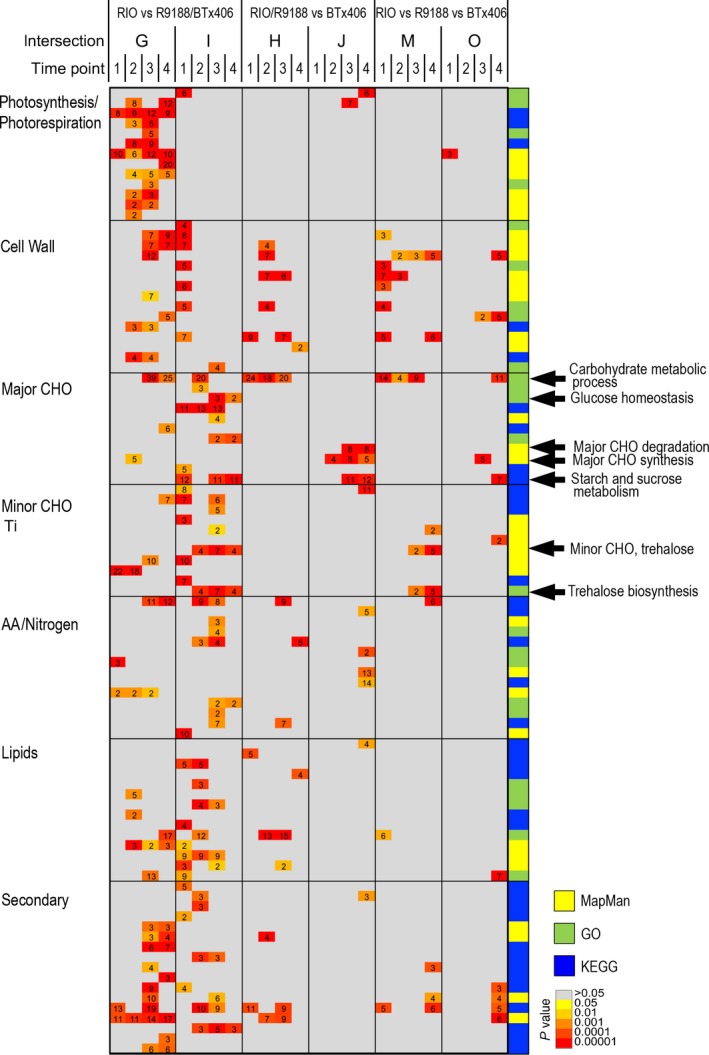
Figure 3.

Functional enrichment of genes responsible for genotypic differences (P value <0.05 and q value <0.2). The intersections were defined as shared sets of DEGs between genotype comparisons, and they represented the differences in RIO vs R9188/BTx406 (intersections G, I), RIO/R9188 vs BTx406 (intersections H, J) and differences between the three genotypes (intersections M, O; Figure S11).
