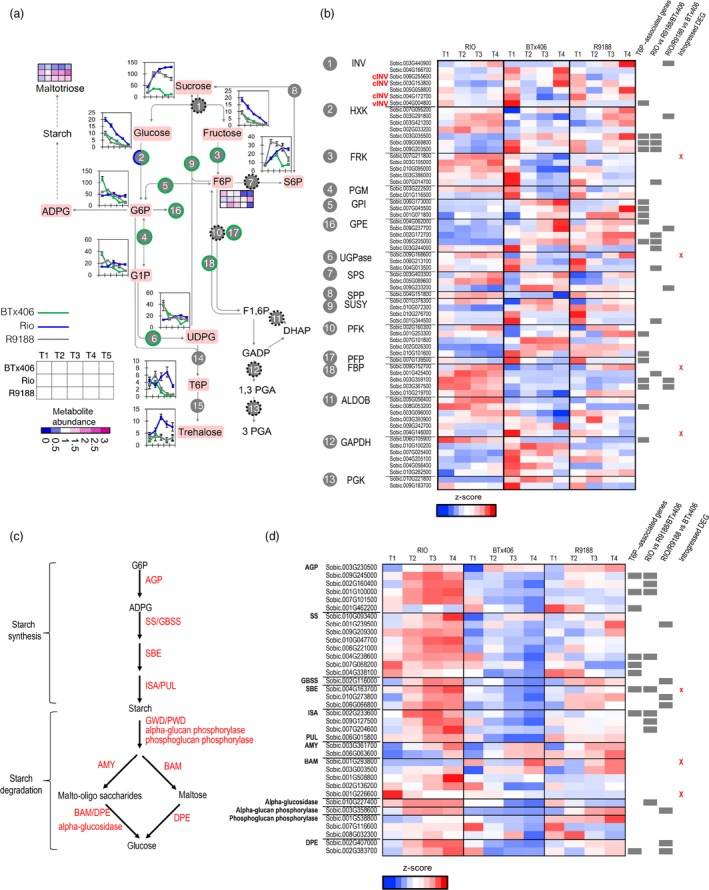
Figure 6.

Transcriptomic and metabolic comparisons of sucrose (a, b) and starch metabolisms (c, d). Green circle: metabolic gene family in R9188 with expression patterns similar to BTx406. Half blue and half green circle indicates several HXKs in R9188 showing expression patterns similar to BTx406, whereas the remaining HXKs exhibited expression patterns similar to RIO. Black broken circle: the gene family showed distinct expression patterns between RIO, R9188 and BTx406. Gene expression levels were normalized by z‐score transformation across genotypes and time points.
