
Figure 5.
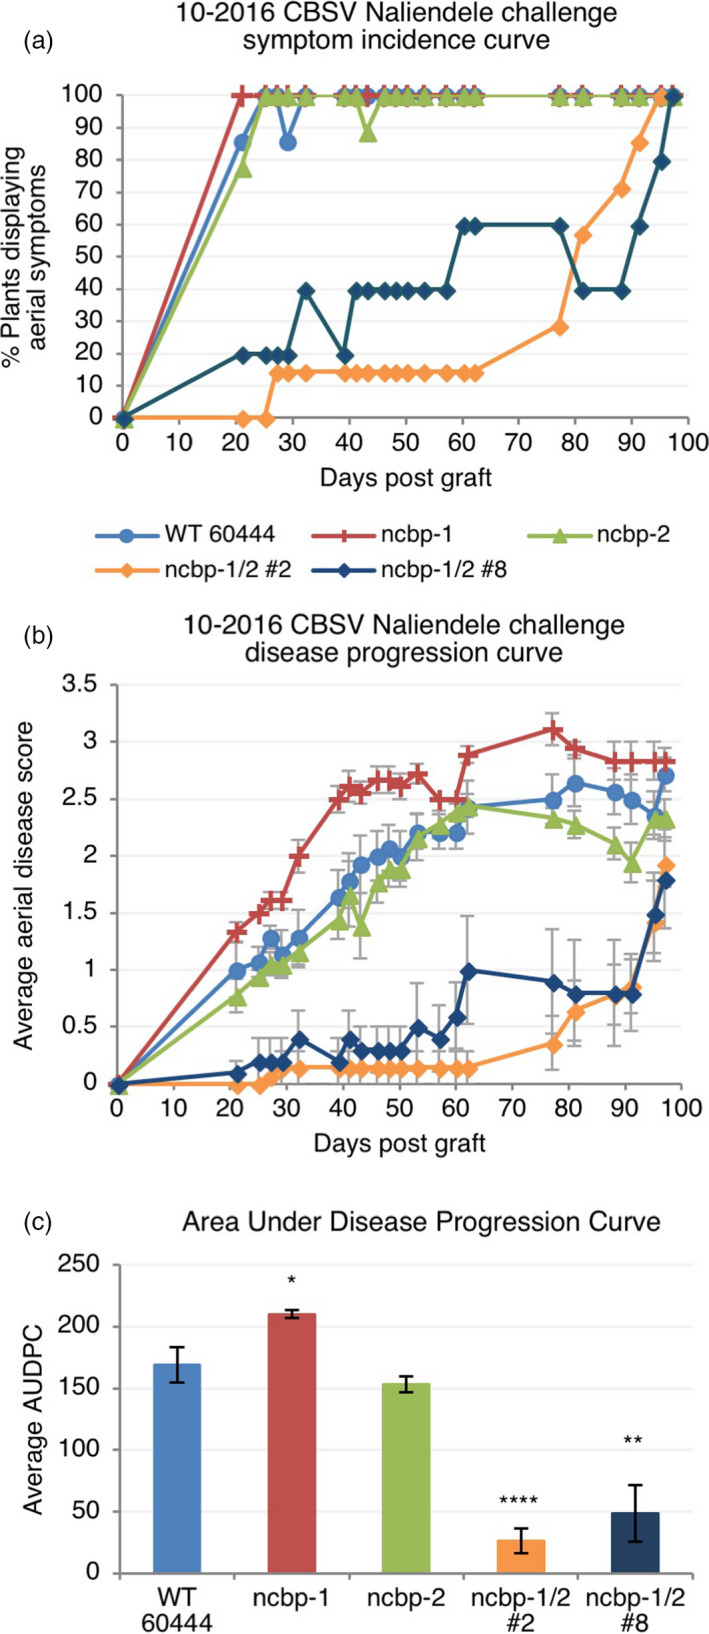
ncbp‐1 ncbp‐2 double mutants exhibit delayed CBSV symptom onset and reduced symptom severity. (a), aerial symptom incidence reported as percent of wild‐type, ncbp‐1, ncbp‐2, or ncbp‐1 ncbp‐2 plants bud‐graft inoculated with CBSV Naliendele isolate. ncbp‐1 ncbp‐2 double mutant lines #2 and #8 are the product of independent transgenic events. (b), disease progression curves for previously described CBSV inoculated plants. Leaf and stem symptoms were each scored on a 0–4 scale and an average aerial score is shown. (c), average area under the disease progression curve (AUDPC) derived from data plotted in (c). Error bars in (c) and (d) indicate standard error of the mean. Statistical differences were detected by Welch's t‐test, n ≥ 5, α = 0.05, *≤0.05, **≤0.01, ****≤0.0001.