
Figure 1.
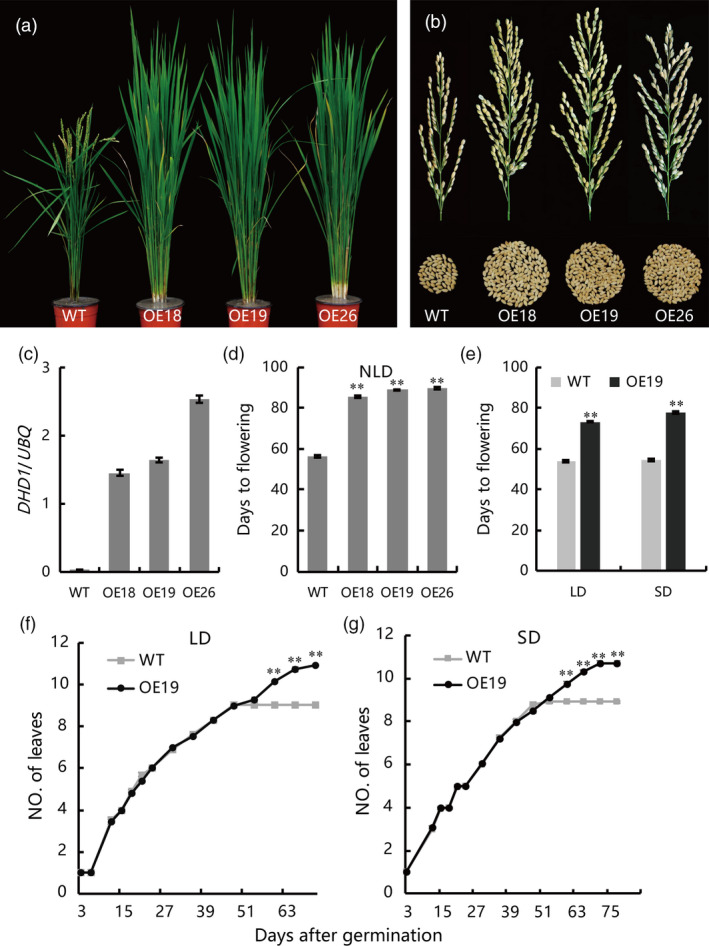
Phenotypes of DHD1‐Flag overexpression lines and wild type (WT) plants under natural LD, control LD and control SD conditions. (a) Phenotypes of overexpression and WT plants. Plants were grown under natural LD conditions for 70 days. OE18, OE19 and OE26, independent overexpression lines of DHD1‐Flag. (b) Main panicle size and grains per panicle of overexpression lines and WT. (c) Expression of DHD1 in overexpression lines and WT. Means ± SE (n = 3). (d) Heading dates of overexpression lines and WT. Means ± SE (n > 15). (e) Flowering time of OE19 and WT under LD and SD conditions. Means ± SE (n > 15). (f) Leaf emergence rate of OE19 and WT under LD conditions. Means ± SE (n > 15). (g) Leaf emergence rate of OE19 and WT under SD conditions. Means ± SE (n > 15), **P ≤ 0.01.