Figure 2.
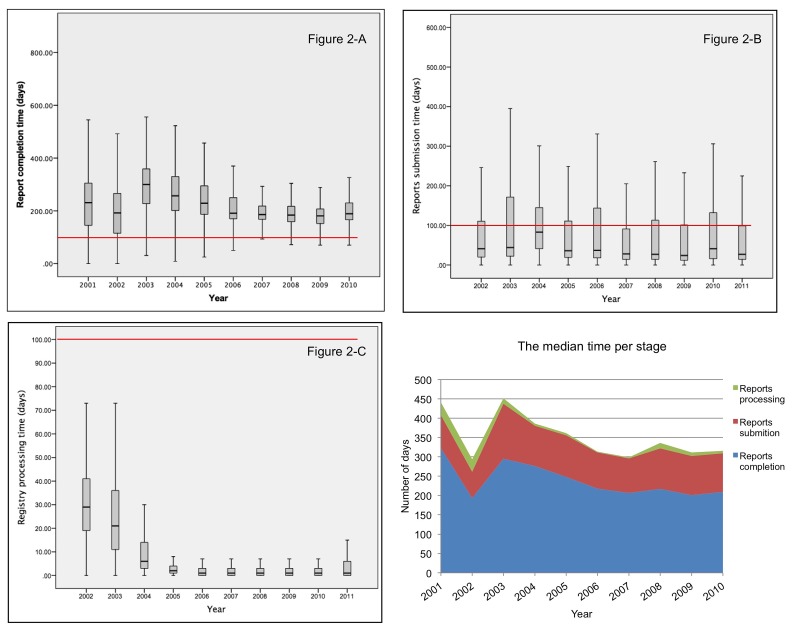
Figure 2-A: Box plot showing the distribution of time taken by facilities to complete reports.
Figure 2-B: Box plot showing the distribution of time taken by facilities to submit completed reports.
Figure 2-C: Box plot showing the distribution of time taken by the central registry to process received reports.
Figure 2-D: comparing the median time for each reporting stage.

