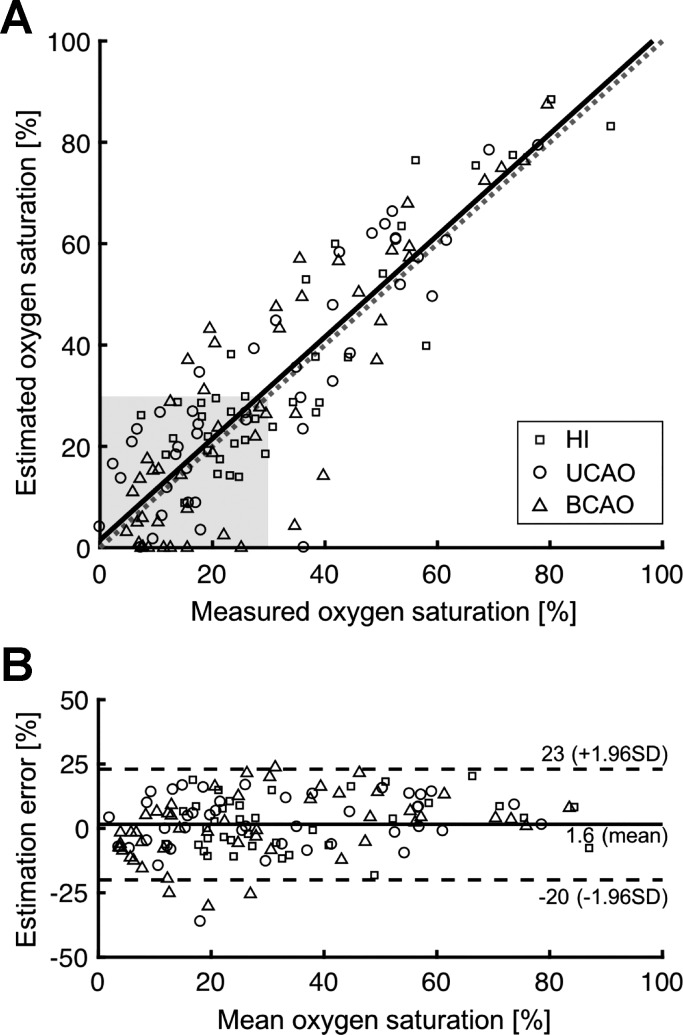
Fig. 4.
Correlation between photoacoustic-estimated and measured O2 saturation in the superior sagittal sinus pooled from all groups. A: the linear regression line (solid line), with slope = 1.00 and y-intercept = 1.49, is close to the line of identity (broken line). Shaded rectangle indicates the critical oxyhemoglobin saturation (So2) range (<30%). B: Bland-Altman estimation analysis plot. HI, hypoxia-ischemia; UCAO, unilateral carotid artery occlusion; BCAO, bilateral carotid artery occlusion.

