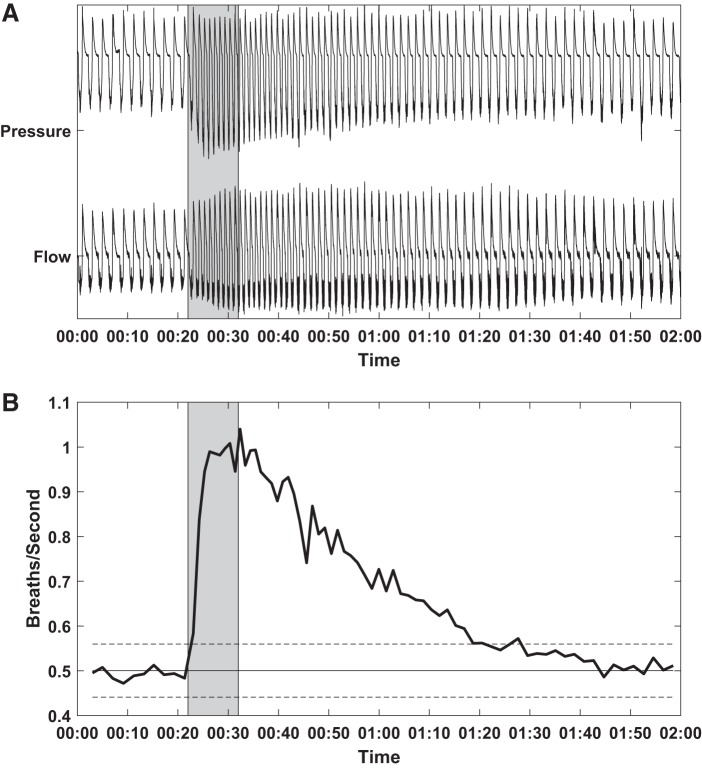
Fig. 2.
Pressure and flow (A) and instantaneous respiratory rate (B). Time shown in minutes and seconds. Stimulation (shaded region) was performed and continued to effect respiratory dynamics for as long as 60 s after the offset of stimulation. B: solid horizontal line is the average breaths per second during the baseline period before stimulation. Dashed horizontal lines indicated ± 2 standard deviations (95% confidence interval). Before transection, 250 μs, 0.25 mA, 35 Hz stimulus.

