
Fig. 4.
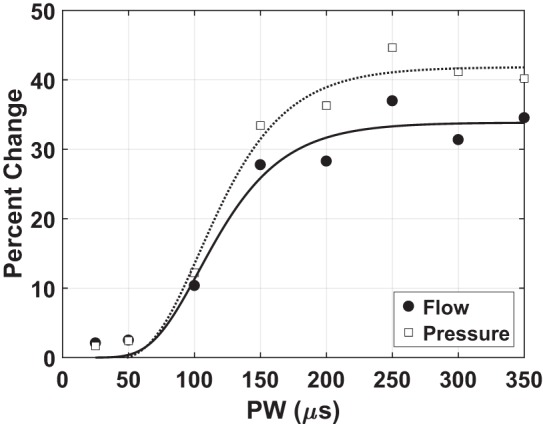
Stimulus pulse width (PW; horizontal axis) and percent change from baseline (vertical axis) in either flow (solid circle) or pressure (open square). Both peak-to-peak flow and peak-to-peak pressure increased during periods of stimulation following distal sciatic nerve transection; however, the changes were proportionate, i.e., not significantly different. Furthermore, the percent change in these metrics increased with increasing stimulus. 0.5 mA, 35 Hz stimulus.