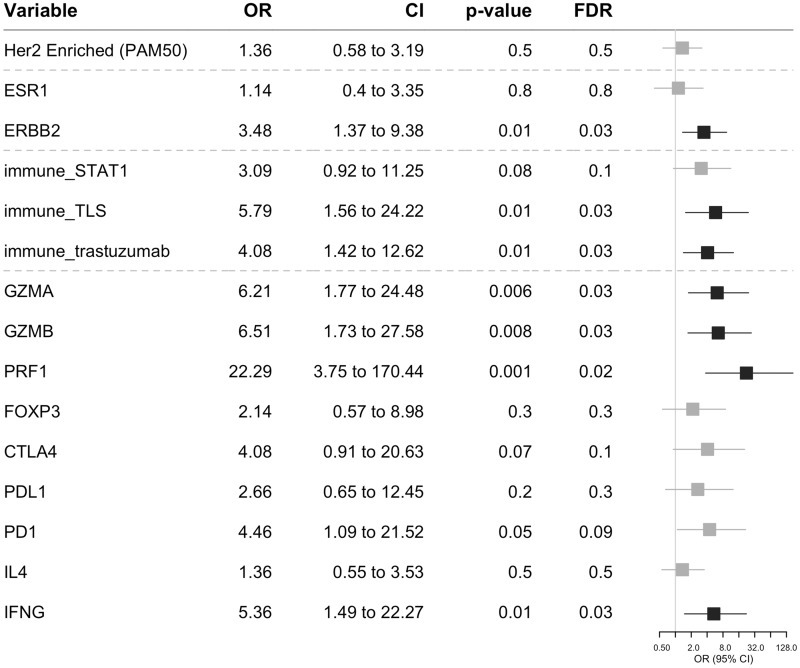
Figure 5.
Adjusted odds ratios (ORs) for pathological complete response for a unit increase in baseline single gene/gene signature score using logistic regression (adjusted for baseline clinicopathological characteristics including age, histology grade, estrogen receptor, clinical stage, chemotherapy, and baseline tumor-infiltrating lymphocytes). Horizontal bars represent the 95% confidence intervals of the ORs. The Wald test was used to obtain P values and correction for multiple testing using the Benjamini-Hochberg procedure. Characteristics with statistically significant (FDR < 0.05) and non–statistically significant effects are shown in black and gray, respectively. CI = confidence interval; FDR = false discovery rate; OR = odds ratio.

