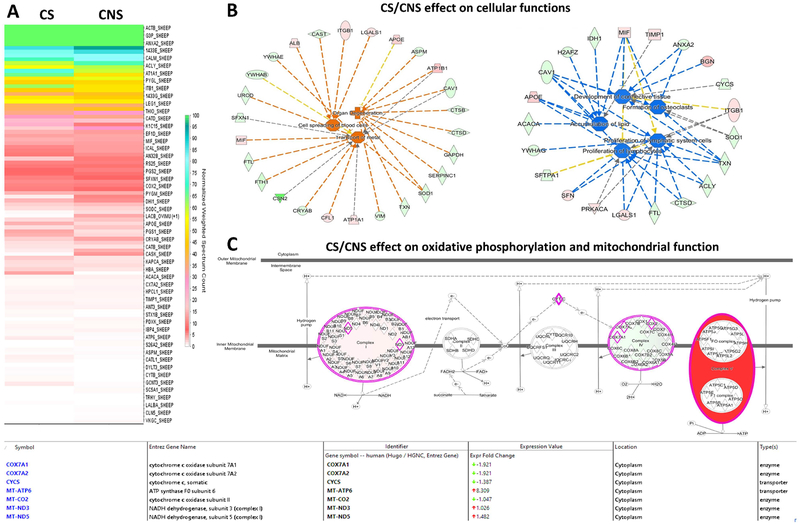
Figure 6: Comparative protein expression profiling of “control stretched” vs “control non-stretched” in the lymphatic muscle cells.
(A) Heat map highlights the change in the protein expression profiles in the “control-stretched (CS))” relative to the “control non-stretched (CNS)” lymph muscle cells. (B) Oxidative phosphorylation and mitochondrial function is displayed as one of the major pathways up-regulated (red-color) in the CS vs CNS sample. The “expression value” associated with each protein found in the experimental data set presented in supplementary table 1 highlights the “ATP synthase F0 subunit” as being top up-regulated protein in CS vs CNS (characterized by more than eight-fold increase in the expression profile). (C) The IPA analysis of cellular networks identified the increased in cellular spreading, transport of metals and organ degeneration up-regulated in the CS vs CNS (z>1.5 and orange/red color). By contrast, the down-regulated cellular pathways in the CS vs CNS (z<−1.5 and blue/green color) identified the development of connective tissue together with the cellular proliferation. The proteins in red and green had a significantly up- or down-regulated expression (p < 0.05), respectively. The shape of symbols denotes the molecular class of the proteins. A solid line indicates a direct molecular interaction, whereas a dashed line indicates an indirect molecular interaction.

