Figure 1.

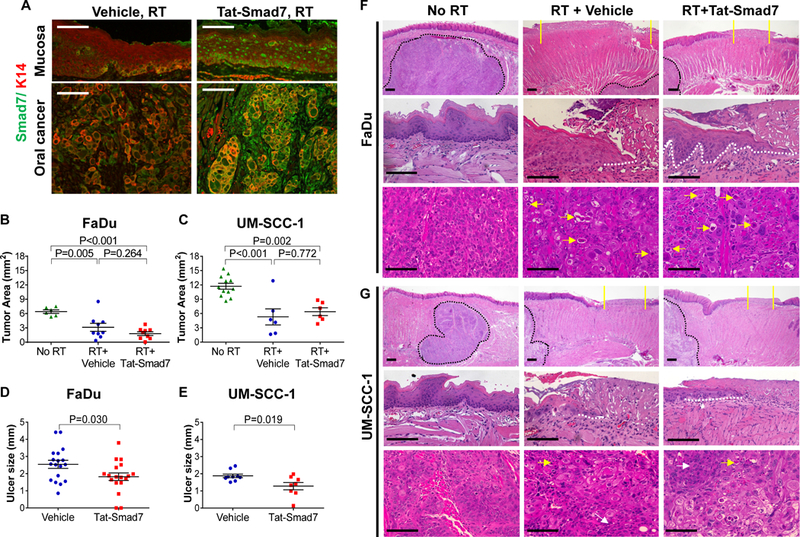
Oral Tat-Smad7 treatment alleviated radiation-induced oral mucositis but did not affect radiotherapy on neighboring oral cancer. (A) Representative immunofluorescent images using Smad7 antibody to detect endogenous Smad7 or Tat-Smad7 in irradiated mouse tongue mucosa and neighboring xenografted FaDu tumor (no endogenous Smad7). Weak endogenous Smad7 was detected in mouse tongue mucosa and oral cancer stromal cells of mouse origin. K14 antibody was used to counterstain epithelial cells. (B, C) Quantification of oral tumor size (mean ± SEM) 10 days after 18 Gy radiation in mice untreated (No RT), treated with RT and vehicle (RT+Vehicle) or RT and Tat-Smad7 (RT+Tat-Smad7). (D, E) Quantification of oral ulcer diameter (mean ± SEM) 10 days after 18 Gy radiation in mice treated as described in panels B and C. P values determined by Student’s t test (two groups) or one way ANOVA with Tukey’s multiple comparison test (more than two groups). (F, G) Representative H&E images of oral mucosa and oral cancer in tongue samples harvested from mice bearing FaDu (F) or UM-SCC-1 (G) tumors 10 days after 18 Gy radiation. Upper panels present low power images of tongue epithelium and tumor. Yellow solid lines define the ulcer boundary. Black dotted lines delineate the boundary of tongue tumor. Scale bars = 200 μm. Mid panels present high power images of oral epithelium from non-irradiated posterior dorsal tongue mucosa and irradiated mucosa from the same region with ulcer. White dotted lines delineate epithelial cells migrated underneath the ulcer. Scale bars = 100 μm. Lower panels present high power images of the oral cancer. Yellow arrows point to dying or apoptotic tumor cells. White arrows point to areas without obvious RT-induced damage. Scale bars = 100 μm.
