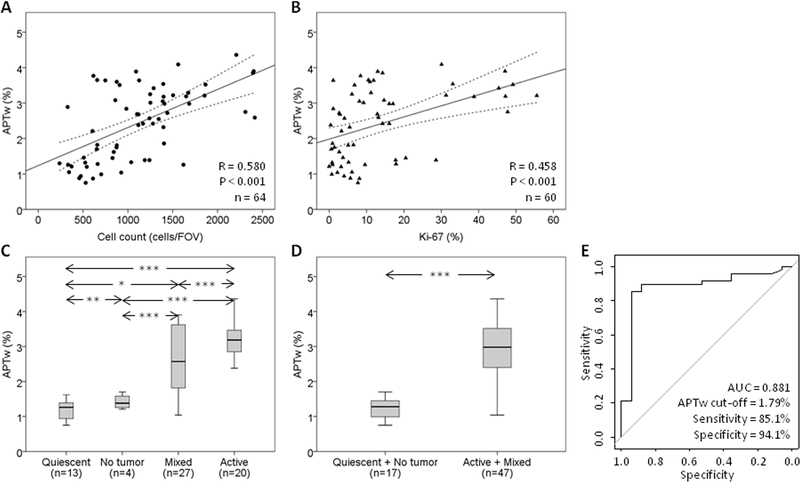
Fig. 3.
Quantitative analysis of APTw imaging intensities. A, Correlation of APTw intensities with Cellcount using simple linear regression: y = 1.19 + 1.14E-3*x. B, Correlation of APTw intensities with Ki-67 using simple linear regression: y = 1.76 + 0.04*x. C, Quantitative comparison of APTw imaging intensities using box plots that correspond to quiescent, mixed, and active specimens, as well as non-tumor specimens. D, Quantitative comparison of APTw imaging intensities that correspond to treatment effect (non-tumor and quiescent) and tumor recurrence (mixed and active). * P < 0.05; ** P < 0.01; *** P < 0.001. E, ROC analysis of APTw imaging intensities as an imaging biomarker with which to distinguish active glioma from treatment effect.

