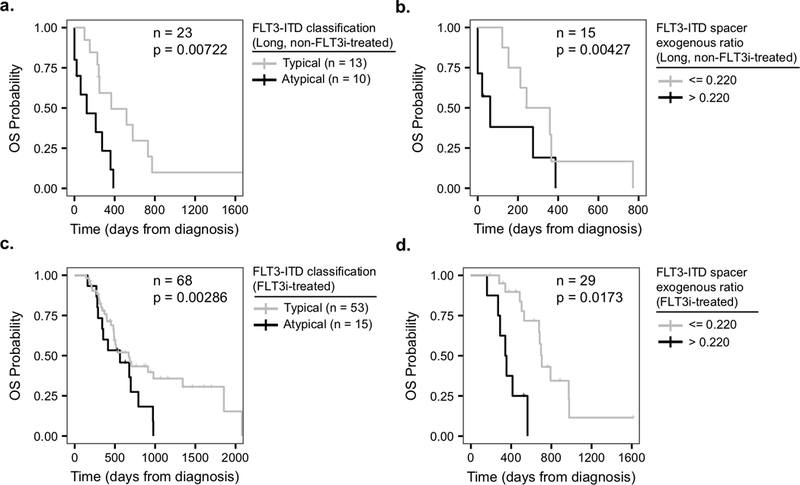
Figure 5. Correlation between ITD features and overall survival for the FLT3-ITD-positive AML patients.

a) Individuals with typical (gray, median: 366 days) vs. atypical (black, median: 122 days) clones in the non-FLT3i-treated cohort with duplication segment lengths > 29 bp (top third quartile) (n = 23, Cox PH: HR = 0.226, CI = 0.0764 – 0.669, p = 0.00722). b) Comparison of OS between non-FLT3i-treated individuals carrying ITDs with duplication segment lengths > 29 bp (top third quartile) with various exogenous ratio values, as defined by exogenous segment length / spacer segment length (n = 15, Cox PH: HR = 159.0, CI = 4.92 – 5160, p = 0.00427). For visualization purposes a high / low cutoff of 0.22 for the exogenous ratio, which was obtained from a maximum separation analysis, was used to plot the Kaplan-Meier curve. c) Typical (gray, median: 672 days) vs. atypical (black, median: 563 days) for all individuals in the FLT3i-treated cohort (n = 68, Cox PH: HR = 0.337, CI = 0.165 – 0.68, p = 0.00286). d) Comparison of OS between individuals carrying ITDs with various exogenous ratio values in the FLT3i-treated cohort (n = 29, Cox PH: HR = 4.96, CI = 1.33 – 18.5, p = 0.0173). Only for visualization purposes, the exogenous ratio of 0.22 was used to plot the Kaplan-Meier curve as in (b). Cox regressions with allogenic transplant and disease status at the time of FLT3i treatment initiation as additional covariates were used for the FLT3i-treated cohort. In panels (b) and (d), exogenous ratio separations were only used for visualization and not Cox regressions, where the entire spectrum of exogenous ratio values were used and the corresponding p-values were reported.
