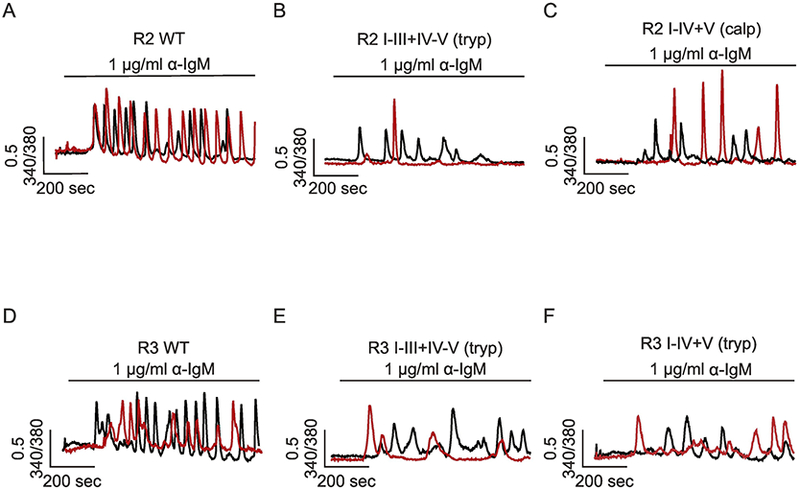
Figure 4.

Region-specific proteolysis regulates R2 and R3 activity. Single cell Ca2+ imaging was performed using cells DT40–3KO cells stably expressing R2 WT (A), R2 I-III+IV-V (tryptic fragments) (B), R2 I-V+V (calpain fragments) (C), R3 WT (D), R3 I-III+IV-V (tryptic fragments) (E), R3 I-IV+V (tryptic fragments) (F). In response to anti-IgM stimulation, cells expressing R2 and R3 WT (A and D) evoked robust Ca2+ oscillations, while cells expressing R2 I-III+IV-V (tryptic fragments) (B), R2 I-V+V (calpain fragments) (C), R3 I-III+IV-V (tryptic fragments) (E), or R3 I-IV+V (tryptic fragments) (F) exhibited only a few irregular transients. Two representative single cell calcium traces (black and red) were shown for each condition. Adapted from [15] with permission.
