
Figure 2:
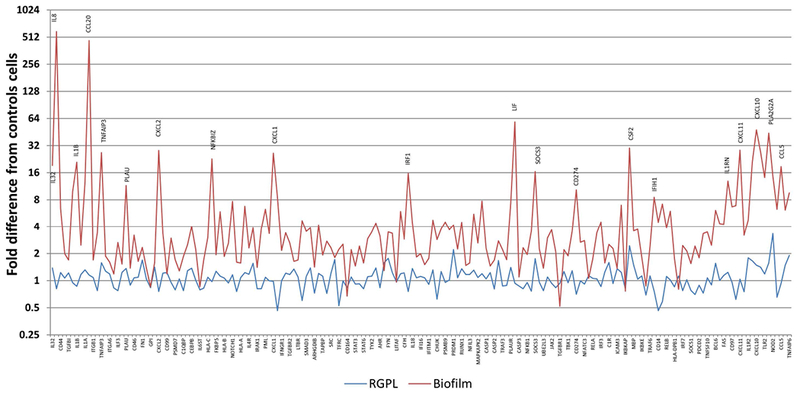
Comparison of fold difference in gene expression with biofilm or RGPL interaction with the oral epithelial cells. Genes are ordered based upon the magnitude of signal expression following biofilm challenge. Control cells represented basal production in media. Values denote the mean of 5 values for the biofilms and 3 for the RGPL.