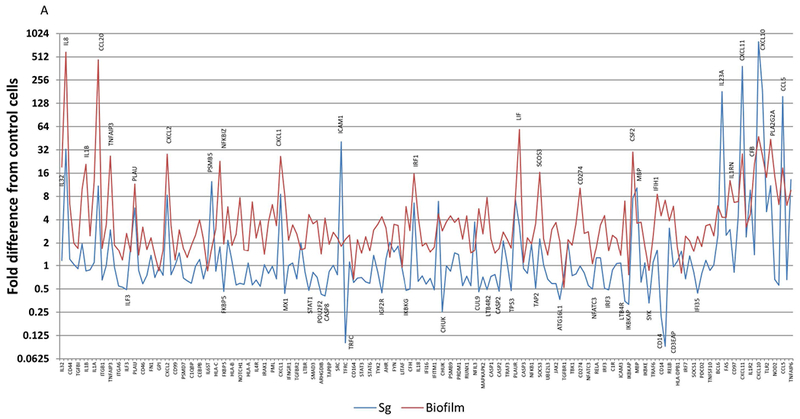
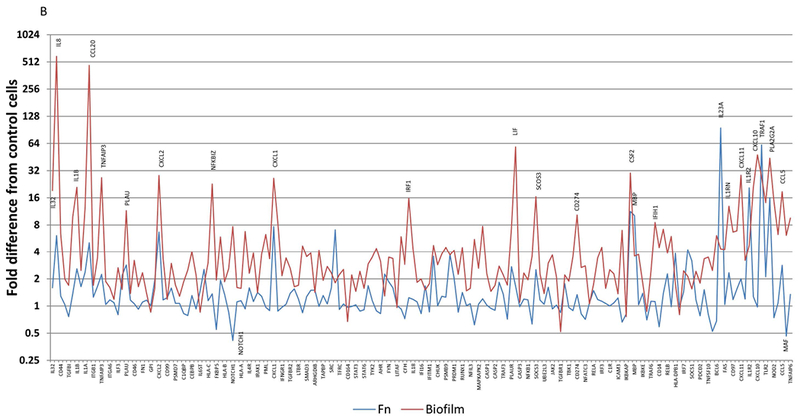
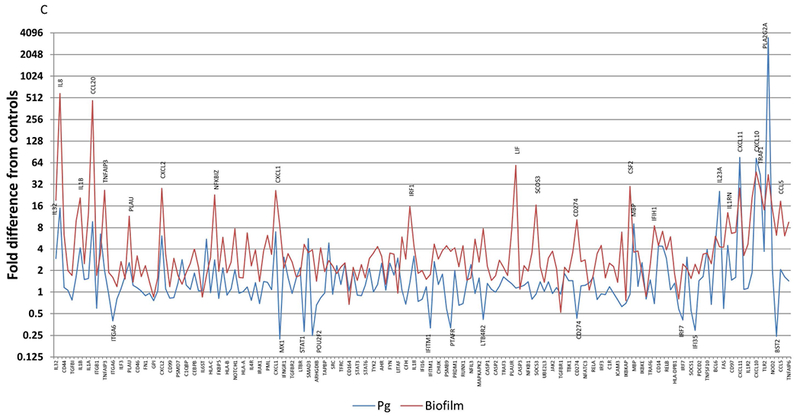
Figure 3A-C:


Comparison of fold differences in gene expression with biofilms compared to individual planktonic bacteria, S. gordonii (A), F. nucleatum (B), and P. gingivalis (C). Highlighted genes are those increased by >8-fold or decreased by >2-fold. Values denote the mean of 5 values for the biofilms and duplicates for the planktonic bacteria.
