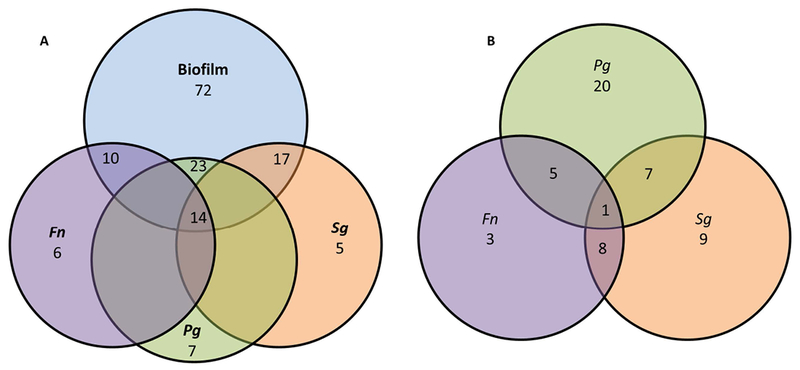
Figure 4:

Venn diagram depicting the number of genes upregulated by (A) biofilm or planktonic bacteria and identifying overlap or unique alteration of the expression levels. (B) Provides similar comparison of gene IDs upregulated among the planktonic bacteria only.
