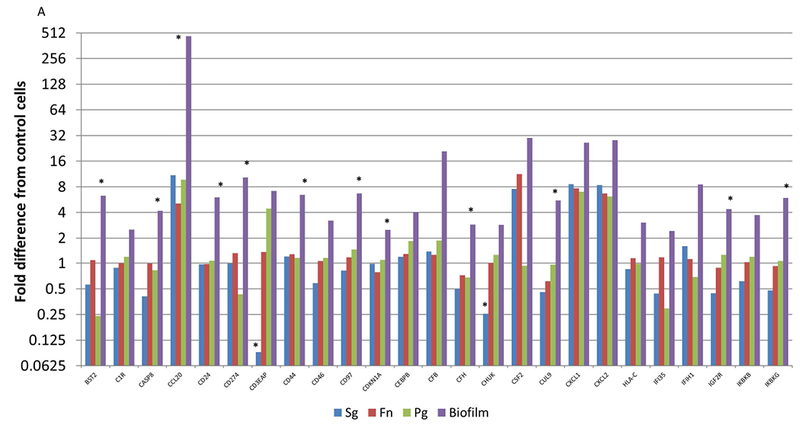
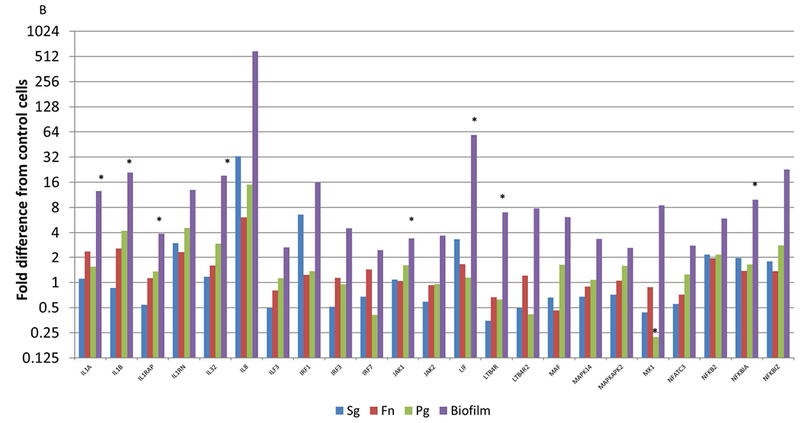
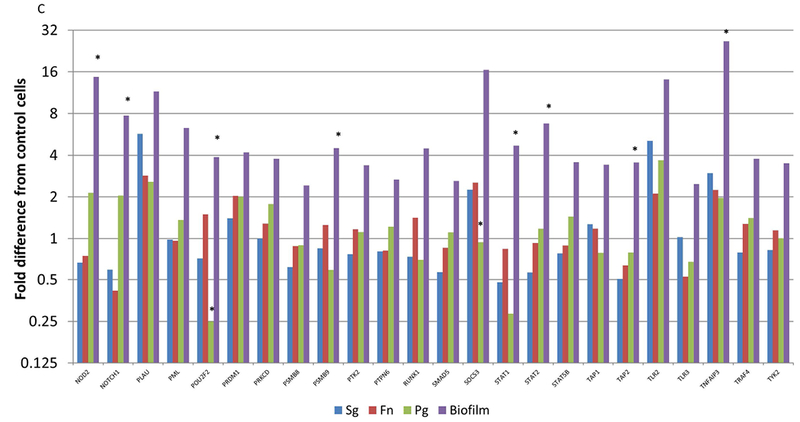
Figure 5A-C:


Identification of genes with at least 2-fold increased expression induced by biofilms compared to all of the planktonic species. Values denote the mean of 5 values for the biofilms and duplicates for the planktonic bacteria. Asterisk (*) denotes at least p<0.01 from the other conditions.
