Fig. 15.
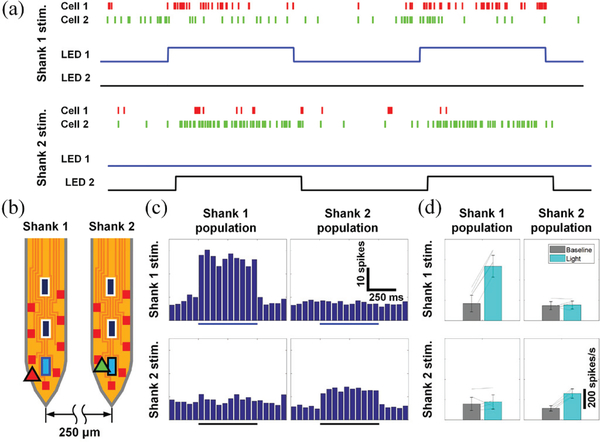
In vivo measurements validating selective location neural stimulation: (a) raster plots of spikes from two optically excited neurons responding to different μLEDs, (b) estimated locations of the neurons and the μLEDs, (c) peristimulus time histograms of the neuronal firing around shanks with the respective μLEDs, and (d) averaged (ncycles = 20) baseline and optically induced population spiking rates. Two-sided Wilcoxon’s signed rank test confirms that activities of only the neurons in the vicinity of an activated LED shank are significantly affected by light (for LED 1, pshank 1 = 0.001, pshank 2 = 0.83, for LED 2, pshank 1 = 0.05, pshank 2 = 0.001). Modified from [20].

