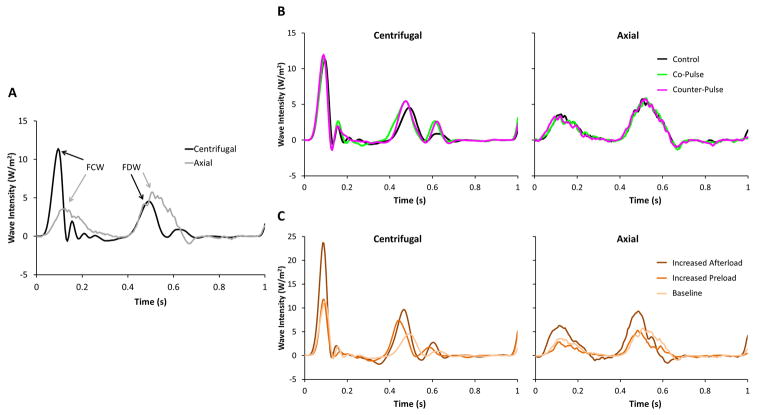
Figure 4. Main pulmonary artery wave intensity patterns with centrifugal and axial pumps.
(A) The net wave intensity is shown during baseline physiologic conditions and control mode (i.e. constant pump speed). The peak intensity of the forward compression wave (FCW) and forward decompression wave (FDW) are labeled. The time domain is normalized to compare cardiac cycles (0 = start; 1 = end) with different heart rates. (B) Effects of pulsatile pump operation on wave intensity patterns are shown during baseline physiologic conditions. Control (i.e. constant speed), co-pulse, and counter-pulse (i.e. speed modulation) modes are indicated by the colored lines. The time domain is normalized to compare cardiac cycles (0 = start; 1 = end) with different heart rates. (C) Effects of physiological interventions on wave intensity patterns are shown during control mode (i.e. constant speed). Each physiologic condition is indicated by the colored lines. The time domain is normalized to compare cardiac cycles (0 = start; 1 = end) with different heart rates.

