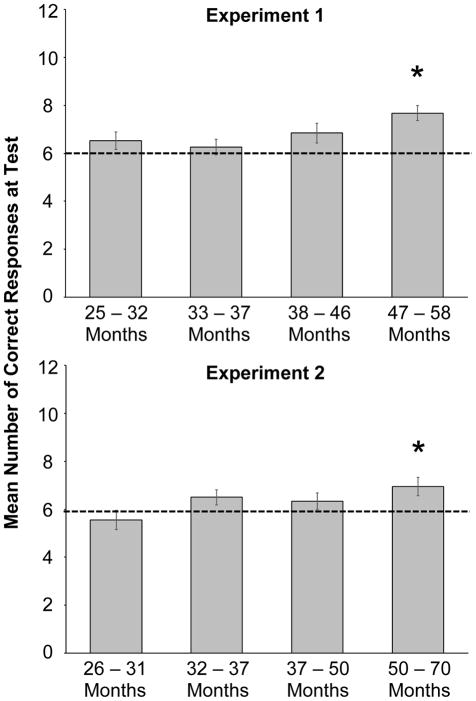
Figure 3.
Mean number of correct responses at test, by age quartile/group, in Experiment 1 and 2. There were no significant differences in mean age in the age quartiles across experiments. Error bars represent one standard error, dashed line represents chance performance, a * indicates group performance that is significantly higher than chance performance, p < .05.

