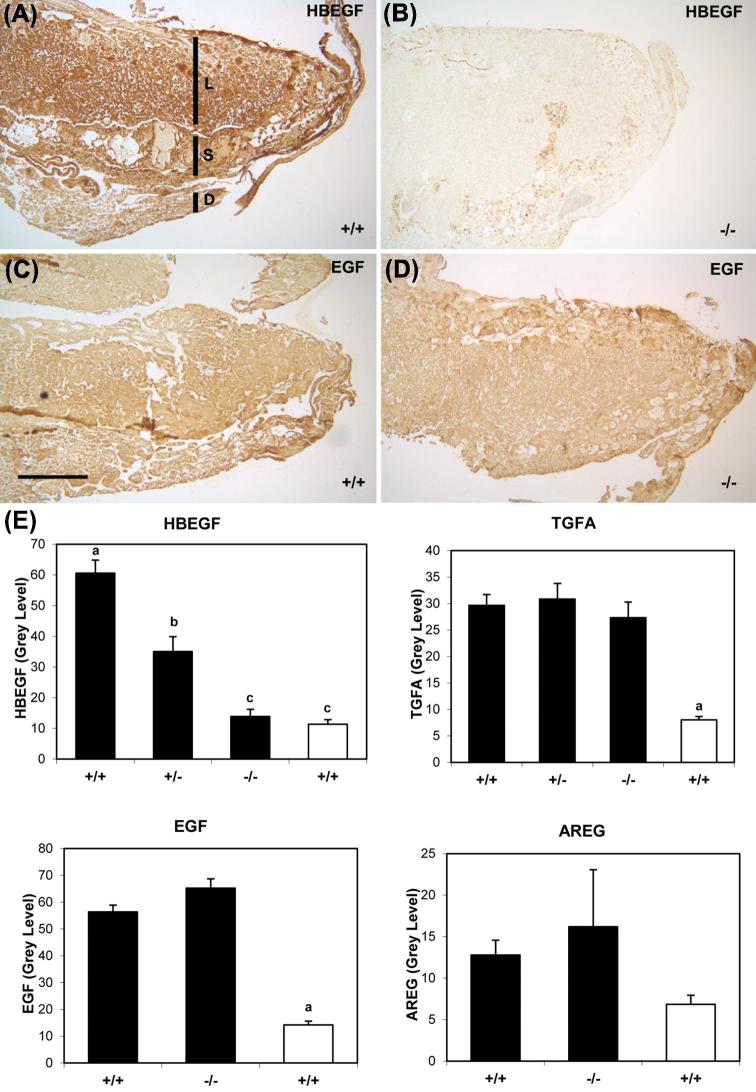
Figure 2.
Expression of EGF family proteins in placentas with different Hbegf genotypes. Immunohistochemistry of HBEGF (A, B) and EGF (C, D) in Hbegf+/+ (A, C) and Hbegf−/−(B, D) placentas. Size bar in C, 500 μm. S, spongiotrophoblast region; L, labyrinth; D, decidua. Semiquantification of expression of HBEGF and TGFA in placentas of the three genotypes (E, top panels), and the growth factors EGF and AREG in Hbegf+/+ and Hbegf–/− genotypes (E, bottom panels) are shown. The open bars indicate values for placentas in which the antibody had been incubated with recombinant antigen, as described in competition experiment of Materials and Methods section (n = 3). Values are compared to IgG control shown in Supplemental Figure 1. Nonmatching letters over bars indicate P < 0.05.

