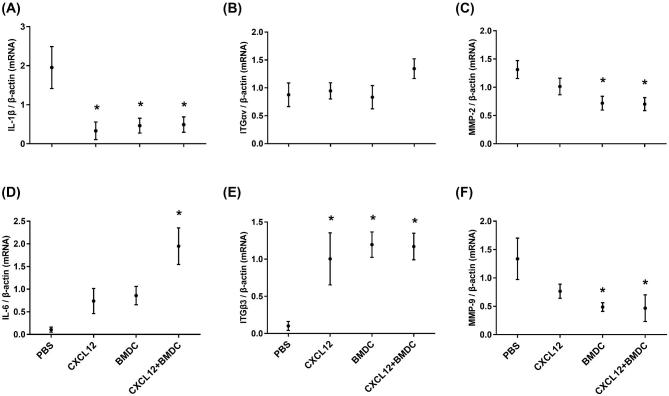
Figure 6.
mRNA expression levels of uterine receptivity markers by qRT-PCR. Interleukins: IL-1β (A) and IL-6 (B); ITGs: ITGαv (C) and ITGβ3 (D); and MMPs: MMP-2 (E) and MMP-9 (F). Data are expressed as the mean ± SEM. * denotes statistical significance (P < 0.05) compared to PBS treatment group. Data represent three individual experiments and each experiment was carried out in duplicate.

