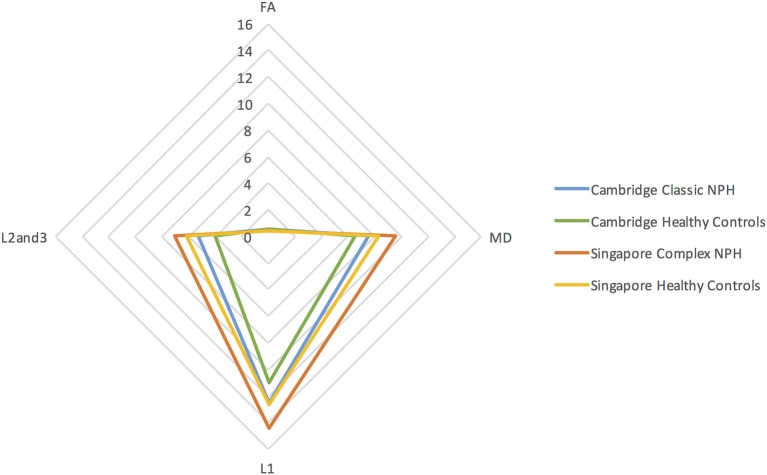
Figure 1.
DTI profiles as radar graphs representing differences across classic NPH, complex NPH, and healthy control cohorts. Due to variations in scanning acquisition between collaborator sites, differences in DTI metrics may not be statistically meaningful. However, DTI profiles provide a methodological tool for comparability across cohorts. As NPH patients displayed worsening functional performance along the disease spectrum (for example, mean MMSE = 24.1 vs. 21.1 for classic vs. complex NPH, respectively), their DTI profiles concurrently worsened to match, across all diffusivity measures. The morphology of DTI profiles also matched the performance of healthy controls (mean MMSE = 28.6 vs. 26.8 for Cambridge vs. Singapore healthy controls).

