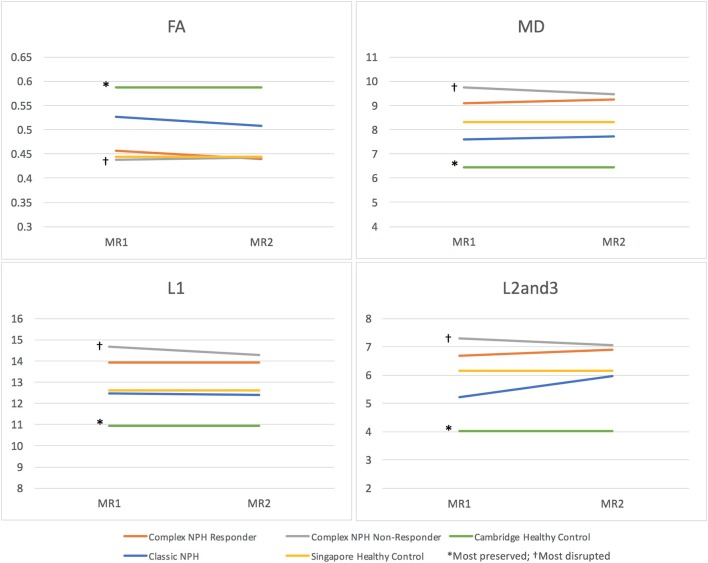
Figure 2.
DTI profiles as line graphs across classic NPH, complex NPH (responder and non-responder), and healthy control cohorts. Differing NPH patient cohorts and healthy controls could be differentiated by the position of their DTI profiles within the spectrum of diffusivity measures. DTI profiles for Cambridge healthy controls* were the most preserved (highest FA, lowest MD, L1, and L2and3), whereas DTI profiles for complex NPH non-responders† were the most disrupted (lowest FA, highest MD, L1 and L2and3).

