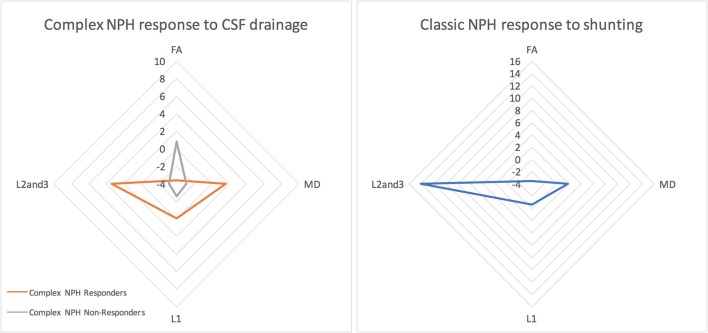
Figure 4.
The morphology of DTI responses to CSF drainage—radar graphs represent percentage (%) changes between pre- and post-intervention DTI profiles in patients. The morphology of DTI profiles for complex NPH responders matched that of classic NPH responders, albeit with a differing magnitude of changes. DTI profiles for complex non-responders demonstrated entirely different morphology to responders with either complex or classic NPH.

