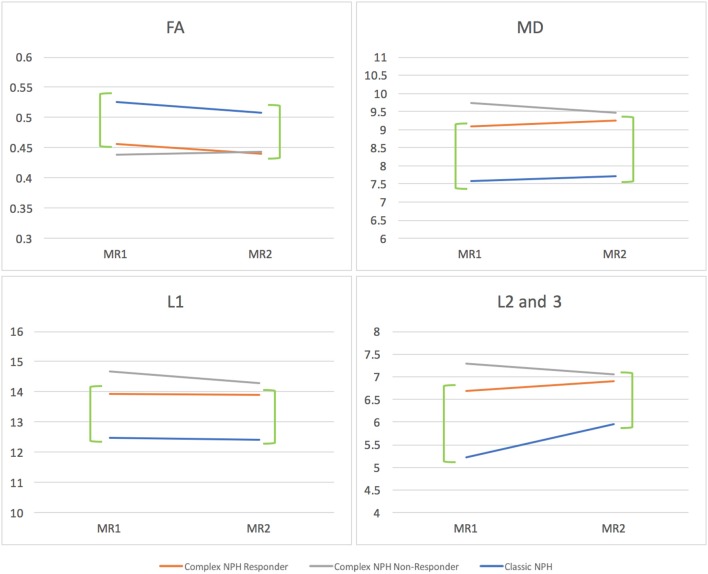
Figure 6.
DTI profiles as line graphs comparing NPH cohorts across the spectrum (complex vs. classic NPH). DTI profiles for complex NPH responders mimicked patterns of changes seen in classic NPH patients across all diffusivity measures (green brackets). MR1 = pre-intervention; MR2 = post-intervention.

