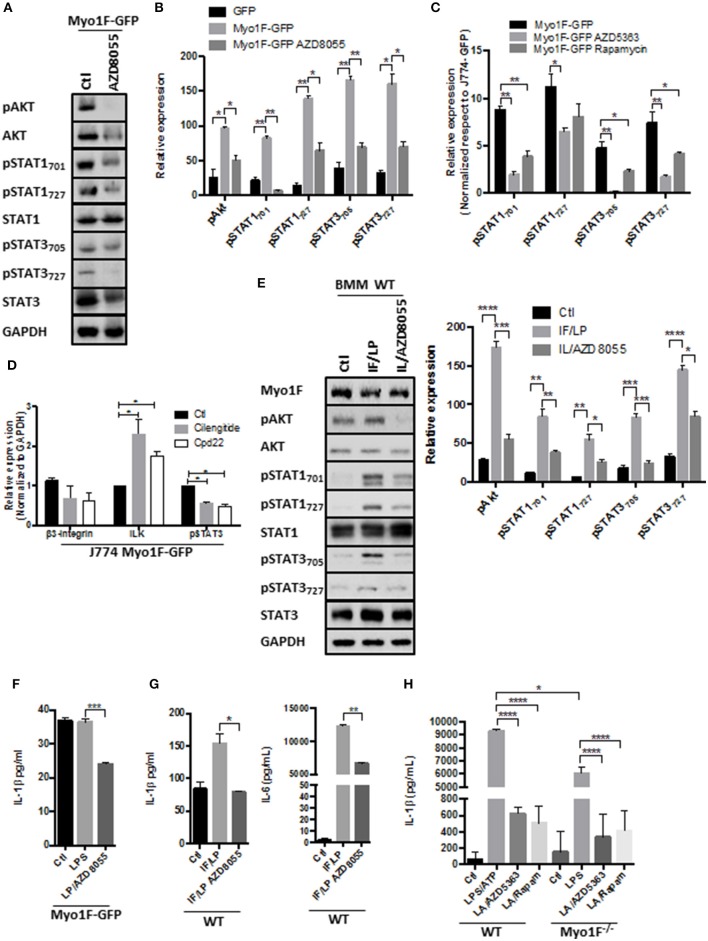
Figure 4.
PI3K/Akt/mTORC1 activates STAT signaling in macrophages downstream of the Myo1F. (A) pAkt473, Akt, pSTAT701, pSTAT727, STAT1, pSTAT3705, pSTAT3727, and STAT3 levels were investigated in J774 Myo1F-GFP cells. AZD8055 (20 nM) was administered. GAPDH was used as loading control. (B) Densitometric analyses obtained from (A) are shown as graphs. *p = 0.05, **p = 0.01. (C) Densitometric analysis for pSTAT701, pSTAT727, STAT1, pSTAT3705, pSTAT3727, and STAT3 in J774 cell overexpressing Myo1F-GFP. AZD8055 (20 nM) or Rapamycin (20 nM) were administered for 5 h. Values were normalized to J774-GFP activity. Graph = Mean ± SD. *p = 0.05, **p = 0.01. (D) Integrin-β3, ILK, and pSTAT3 were analyzed in cell lysates of J774 cells overexpressing Myo1F-GFP. Cilengitide (Integrin-β3 inhibitor; 1 μM) and Cpd22 (ILK inhibitor; 4 μM) were administered for 6 h. Graph corresponding to densitometric analysis derived from three independent experiments is shown. n = 3. *p = 0.05. (E) Western blot for pAkt, Akt, pSTAT701, pSTAT727, STAT1, pSTAT3705, pSTAT3727, and STAT3 was performed in bone marrow-derived macrophages from WT origin. IFN-γ (20 ng/ml)/LPS (1 μg/ml) was carried out (IF/LP) for 5 h. AZD8055 (20 nM) was administered 30 min before IF/LP stimulation. GAPDH was used as loading control. n = 3. Densitometric analyses obtained from those results are shown as graphs. *p = 0.05, **p = 0.01, ***p = 0.0005, ****p < 0.0001. (F) Quantification of IL-1β release by ELISA was investigated in J774 cells overexpressing Myo1F-GFP stimulated with LPS (1 μg/ml) for 5 h. AZD8055 (20 nM) was administered 30 min before LPS stimulation. Graphs are derived from three independent experiments. n = 6. Results are given as mean values ± SEM. ***p = 0.0005. (G) Quantification of IL-1β and IL-6 secretion by ELISA assay was performed in bone marrow-derived macrophages from WT origin. BMM cells were stimulated with IFN-γ (20 ng/ml)/LPS (1 μg/ml) for 5 h. AZD8055 (20 nM) was administered 30 min before IFN-γ/LPS stimulation. Graphs are derived from independent experiments carry out by duplicate. n = 3. Results are given as mean values ± SEM. *p = 0.05, **p = 0.01. (H) IL-1β release was analyzed in supernatants obtained from BMM of WT or Myo1F−/− origin. LPS stimulation (1 μg/ml) was carried out for 4 h follow by 1 h of ATP (freshly prepared, 5 mM) induction. AZD5363 (20 nM) or Rapamycin (20 nM) was administered 30 min before LPS stimulation. Graph = Mean ± SD. *p = 0.05, ****p < 0.0001.

