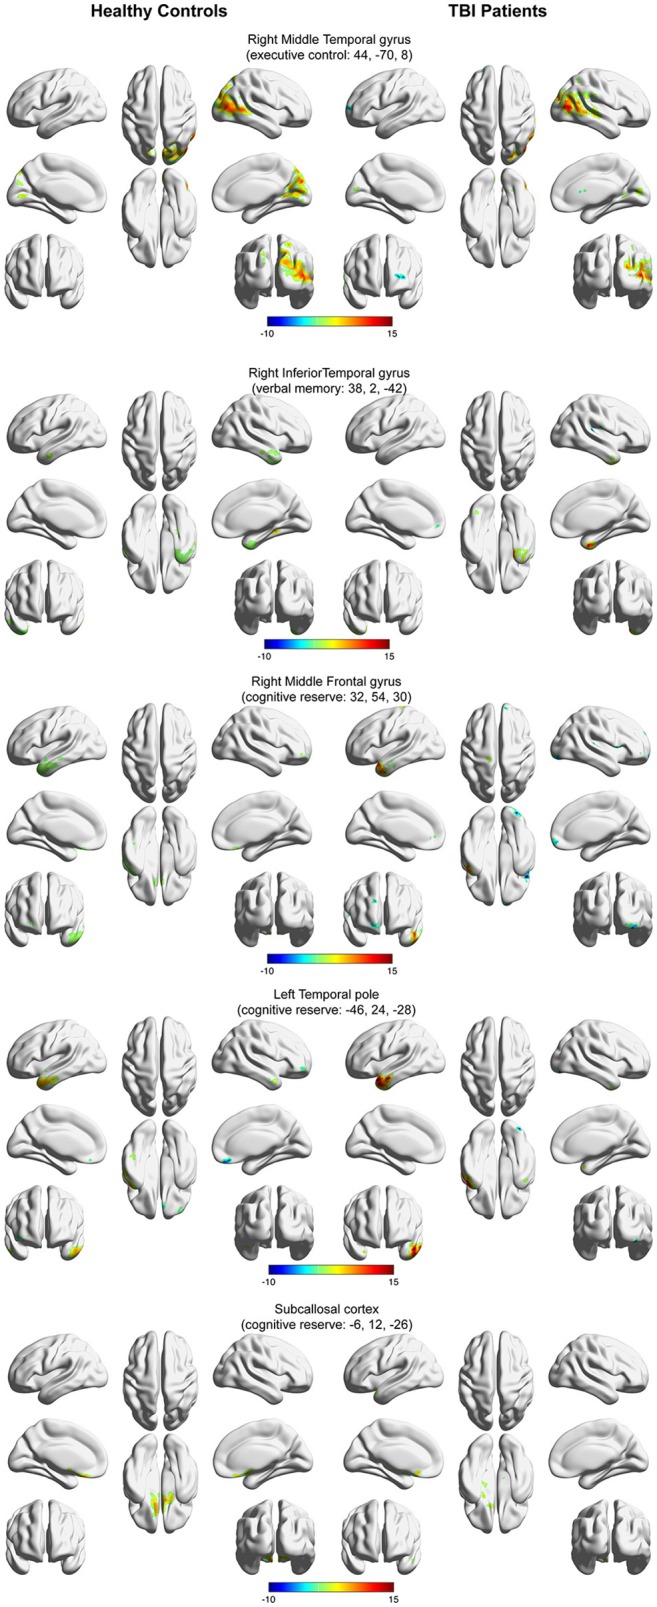
Figure 4.

Within-group functional connectivity maps calculated from seed areas showing a significant interaction between the healthy controls and the TBI participants. Voxels showing significant positive functional connectivity are shown in red–yellow color scale, and voxels showing significant negative functional connectivity are shown in green-blue color scale.
