Figure 4.

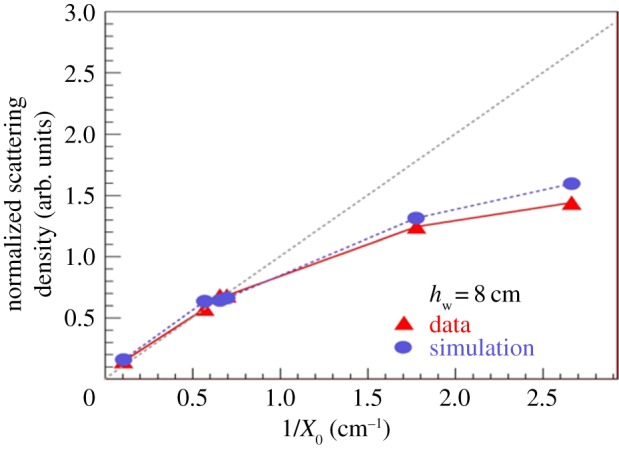
Correlation between the reconstructed scattering density and the expected value (inverse of the scattering length). The tungsten is 8 cm high while all the other samples are 10 cm high.

Correlation between the reconstructed scattering density and the expected value (inverse of the scattering length). The tungsten is 8 cm high while all the other samples are 10 cm high.