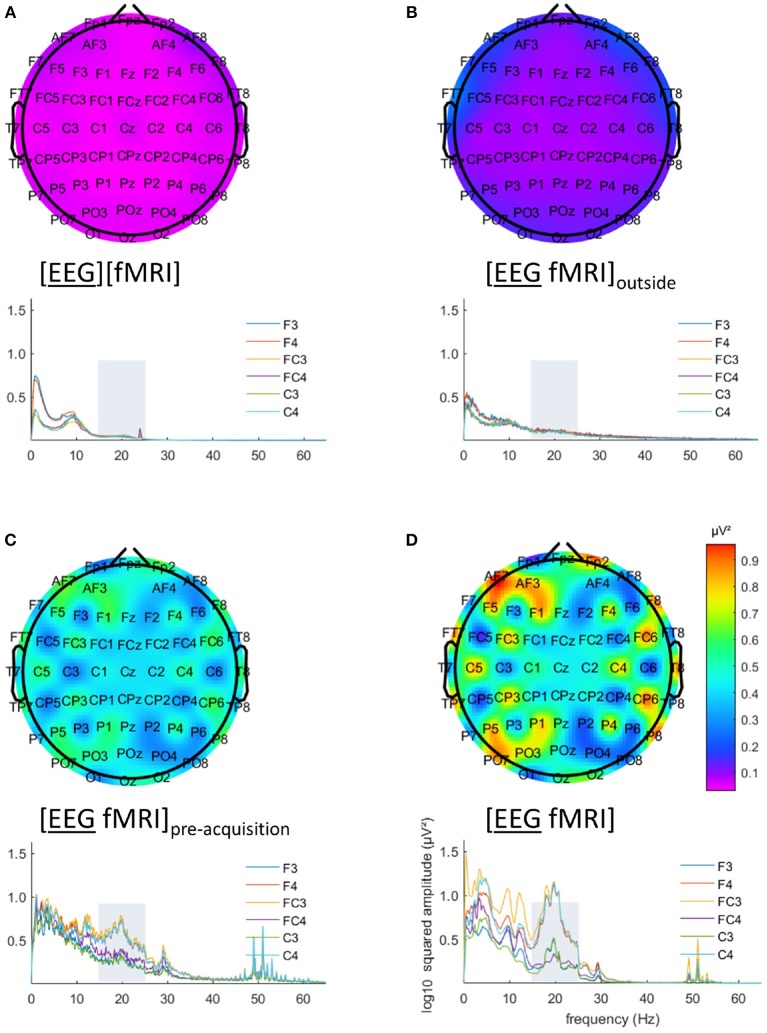
Figure 3.
Electroencephalography (EEG) analysis: topographic plots of the logarithm (base 10) of the mean squared amplitude of the fast Fourier transform (FFT) in the frequency range 15–25 Hz (top) and frequency × squared amplitude of the FFT curves of example electrodes F3/4, FC3/4 and C3/4 (bottom) for the mean of all five subjects, for the different recording conditions, as captured from our graphical user interface: EEG (A) recorded separately during the task ([EEG][fMRI]), (B) recorded in the scanner control room during rest ([EEG fMRI]outside) (C) recorded inside the scanner during rest before image acquisition ([EEG fMRI]pre−acquisition) and (D) recorded inside the scanner during the task with image acquisition ([EEG fMRI]).

