Figure 5.
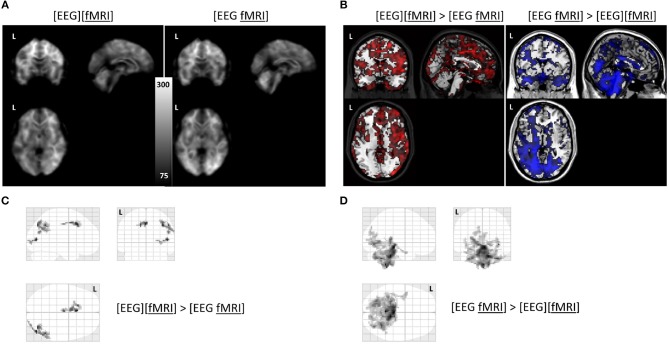
Functional magnetic resonance imaging (fMRI) analysis: (A) average temporal signal to noise ratio (TSNR) maps in the separate and simultaneous recording condition; (B) unthresholded T-map overlayed on brain template ch2 available in MRIcron. Positive T-values are shown in red (corresponding to TSNR values which are bigger in the separate compared to the simultaneous condition; negavitve T-values are shown in blue (corresponding to the reverse contrast). (C) glass brain view of the clusters with a higher TSNR in the recording condition without electroencephalography (EEG) electrodes ([EEG][fMRI]) compared to the recording condition with EEG electrodes ([EEG fMRI]) and (D) the reverse comparison. L = left.

