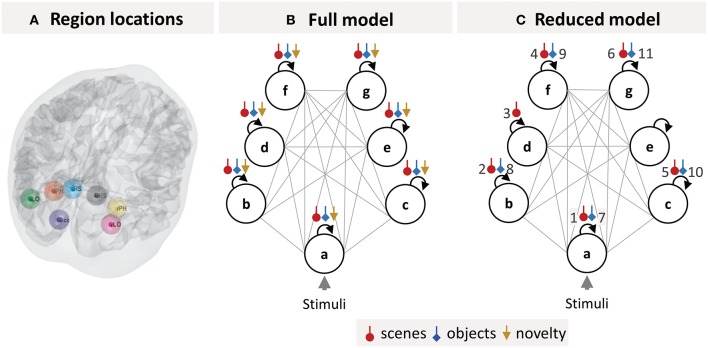
Figure 3.
DCM specification. (A) Locations of the seven brain regions included in the DCM projected onto a canonical brain mesh. (B) Structure of the DCM model estimated for each subject. The circles are brain regions, which were fully connected to one another (gray lines). The self-connection parameters (black arrows), which control each region's sensitivity to input from other regions, were modulated by each of the three experimental manipulations (colored arrows). (C) The optimal group-level (GLM) model after pruning away any parameters that did not contribute to the free energy. The numbered parameters correspond to the bar charts in Figure 4. Key: a, early visual cortex; b, left lateral occipital cortex; c, right lateral occipital cortex; d, left parahippocampal cortex; e, right parahippocampal cortex; f, left retrosplenial cortex; g, right retrosplenial cortex.

