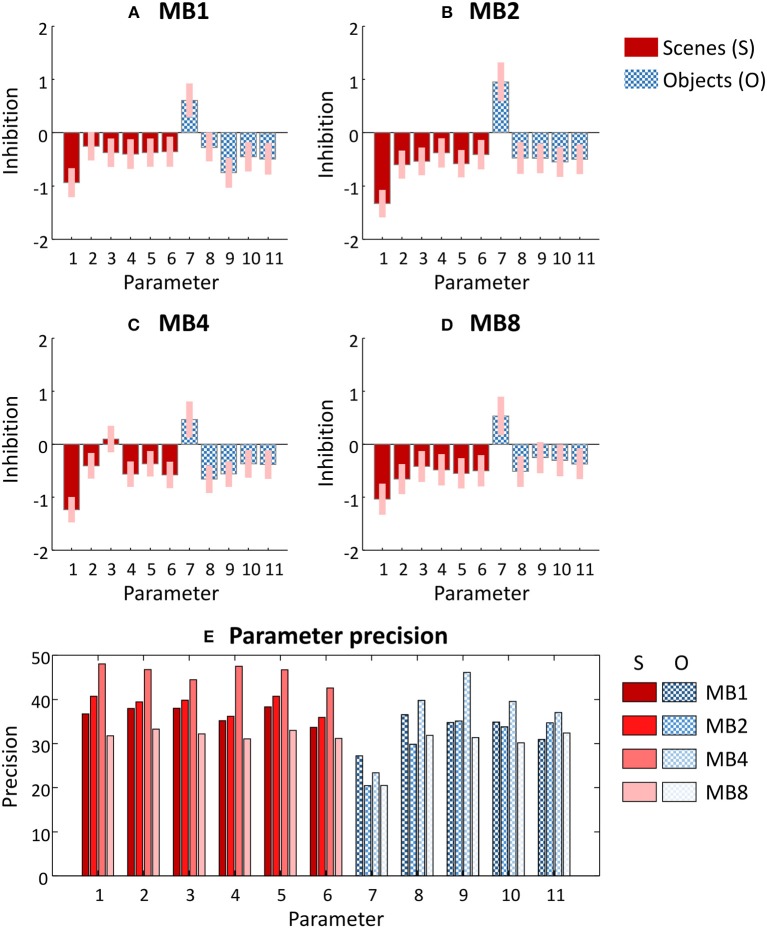
Figure 4.
Parameters of the group-level General Linear Model fitted to each dataset. (A–D) Posterior estimates of each parameter from each dataset. The bars correspond to the parameters labeled in Figure 3C, and for clarity these are divided into regional effects of scene stimuli (solid red) and of object stimuli (chequered blue). These parameters scale the prior self-connection of each region, and have no units. Positive values indicate greater inhibition due to the experimental condition and negative values indicate disinhibition (excitation). Pink error bars indicate 90% confidence intervals. MBx, multiband acceleration factor x. (E) The precision of each parameter—i.e., the inverse of the variance which was used to form the pink error bars in (A–D). Parameters 1–6 relate to the effects of scene stimuli (S) and parameters 7–11 relate to the effects of object stimuli (O). Each group of four bars denote the four datasets in the order MB = 1, 2, 4, and 8 from left to right.

