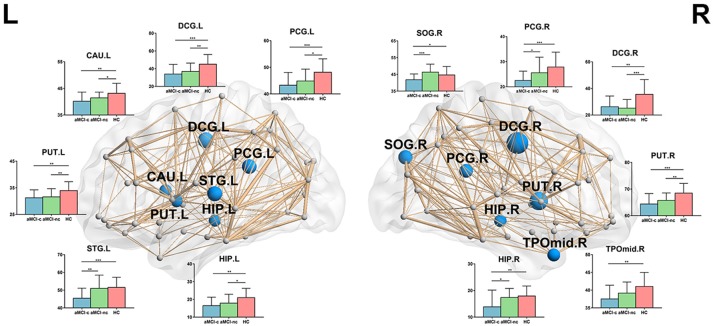
Figure 4.
The distribution of brain regions with significant group effects in the nodal local efficiency among the three groups (p < 0.05, corrected). The node sizes indicate the significance of group differences in the nodal local efficiency. For each node, the bar and error bar represent the fitted values and the standard deviations, respectively, of the nodal local efficiency in each group. post-hoc tests revealed that all of these regions had a reduced nodal local efficiency in aMCI converters compared with controls. In seven of these regions, including the bilateral putamen, bilateral median cingulate, and paracingulate gyri, left posterior cingulate gyrus, left hippocampus and left caudate nucleus, reduced local efficiency was observed in aMCI non-converters compared with controls. Between the two aMCI groups, four regions (left superior temporal gyrus, right superior occipital gyrus, right posterior cingulate gyrus, and right hippocampus) showed a more severe disruption of local efficiency in the aMCI converters relative to non-converters. (*) represents a significant group difference at p < 0.05; (**) represents a significant group difference at p < 0.01; and (***) represents a significant group difference at p < 0.001.

