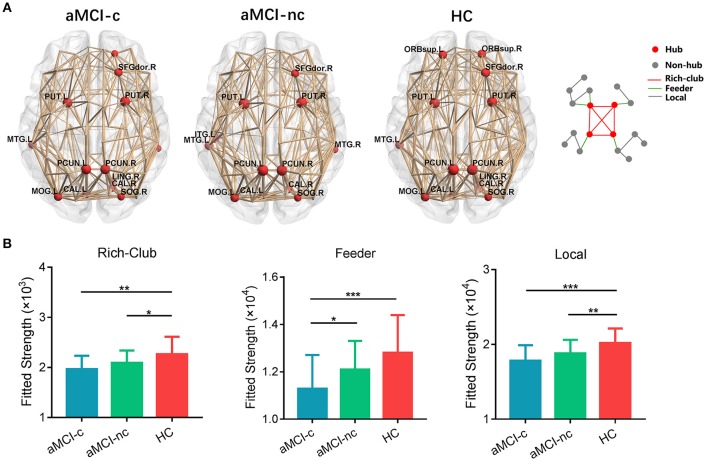
Figure 6.
Hub distributions of the WM structural network in the aMCI converter, aMCI non-converter and control groups. (A) The hub nodes are shown in red with the node sizes indicating their nodal degree. The networks shown here were constructed by averaging the WM connection matrices of all the subjects in each group with a sparsity of 10%. (B) The group differences in the rich-club/feeder/local connection strengths. The bars and error bars represent the fitted values and the standard deviations, respectively, of the connection strength in each group. (*) represents a significant group difference at p < 0.05; (**) represents a significant group difference at p < 0.01; and (***) represents a significant group difference at p < 0.001.

