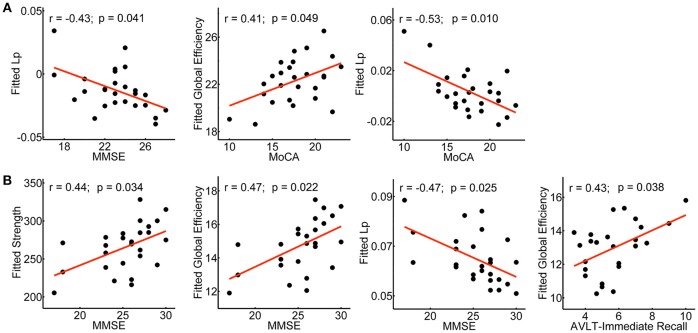
Figure 7.
Clinical correlations of the network metrics in aMCI converters and non-converters. Plots showing the significant correlations between the network metrics and the clinical scores in aMCI converters (A) and non-converters (B), respectively. The fitted values indicate the residuals of the original values of the network metrics after removing the effects of age, gender and years of education.

