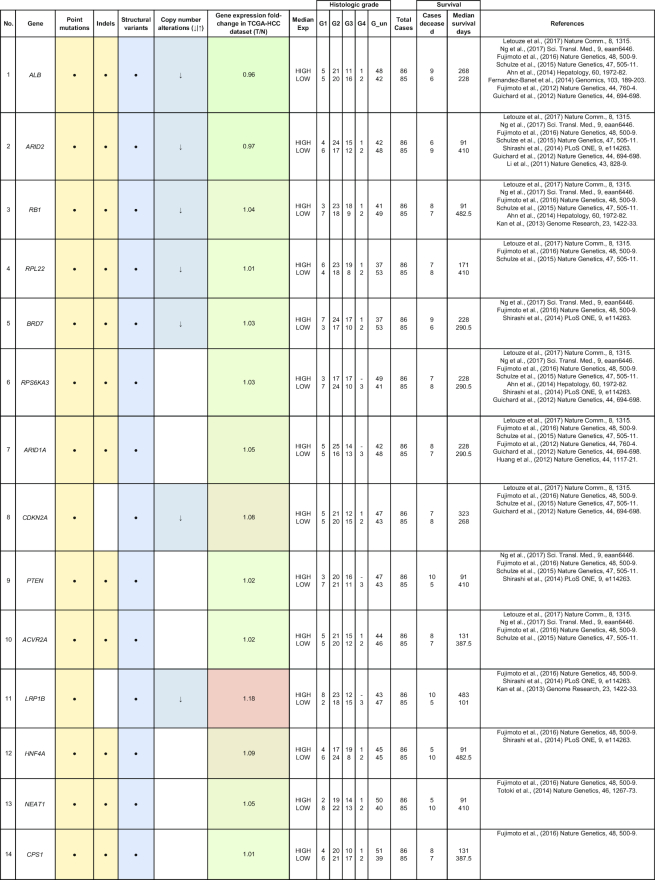
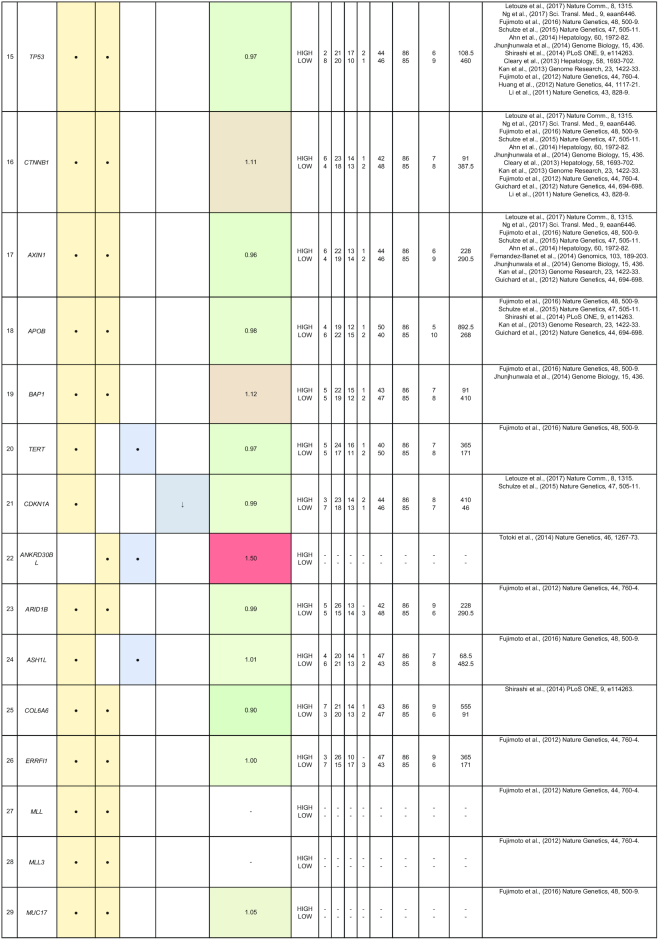
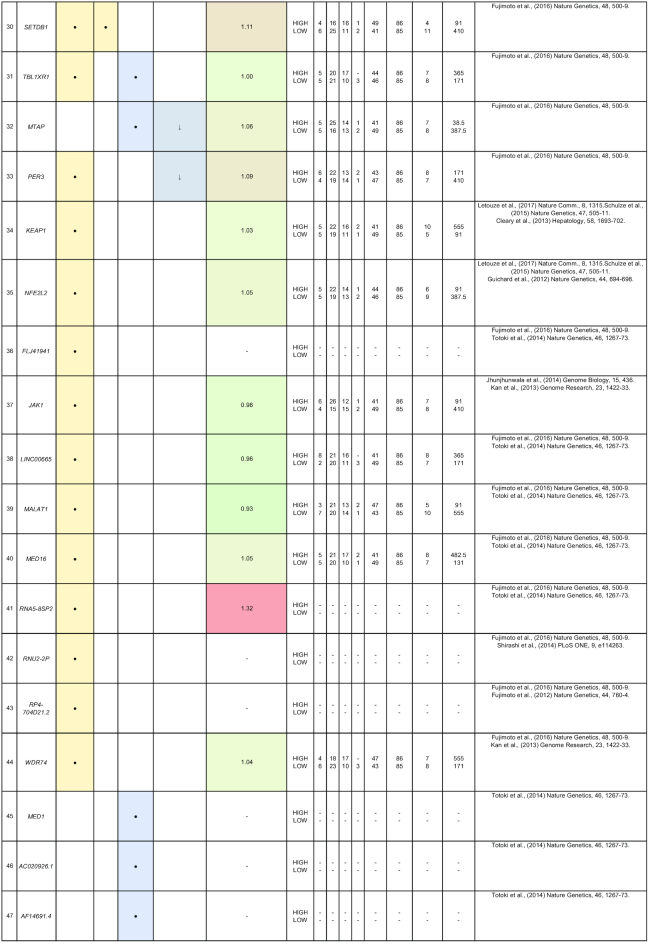
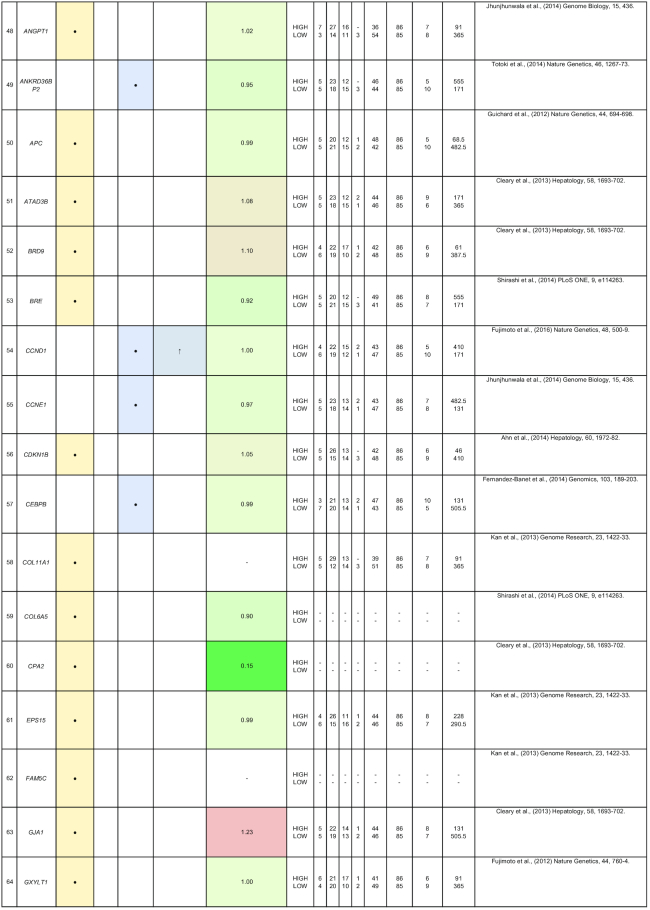
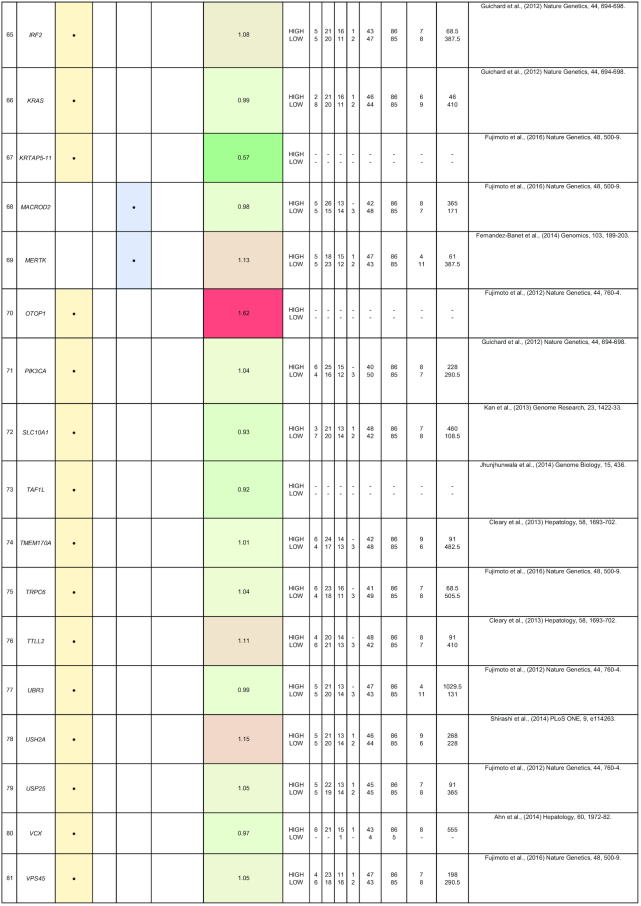
Table 2:
Summary of mutations in liver cancer identified through high-throughput genomics data including their association with gene expression and clinical phenotype
|
|
|
|
|

|
The table indicates the nature of the mutation (single-nucleotide variant [SNV], indels, structural variants, or copy number alterations) in the coding regions. The fold-change of the gene is obtained from the TCGA microarray analysis on HCC patient samples. Histologic grade refers to degree of tumor grade: G1 to G4; G_un indicate cases with unidentified histologic grading. The cases are segregated into HIGH or LOW based on their median gene expression (Median Exp). SNVs and indel mutations are indicated by the yellow box (●), structural variants by the blue box (●), and copy number alterations by the gray box (↓|↑).
