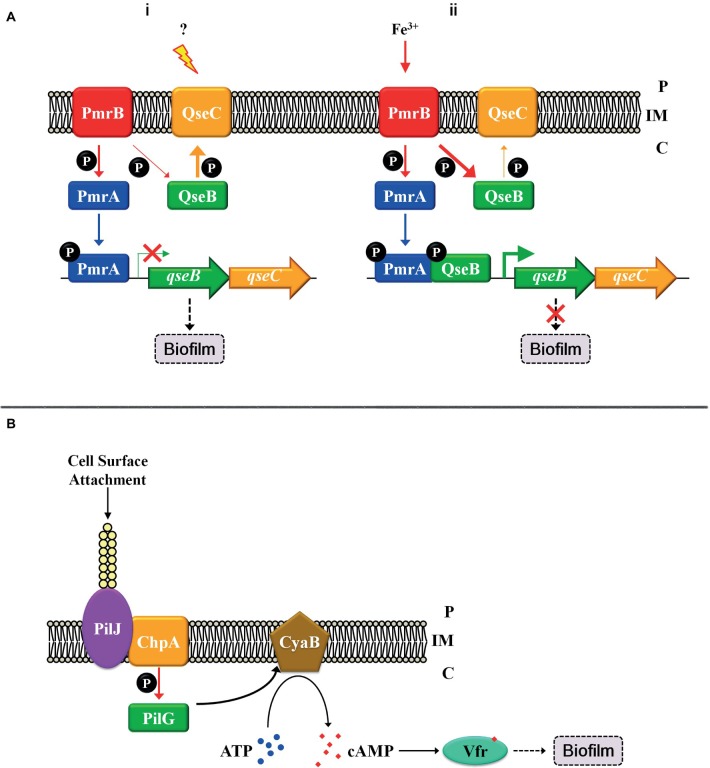
Figure 2.
Cross-regulation patterns and the “control system” with TCS. (A) Cross-regulation between PmrB-PmrA and QseC-QseB. (i) The regulatory pattern in QseC-activated conditions; (ii) The regulatory pattern in PmrB-activated conditions. (B) Solid surface signal activates TCS ChpA-PilG by TFP. Thick arrows indicate robust regulation, and thin arrows represent weak regulation. Inner membrane (IM). Periplasm (P), cytoplasm (C).

