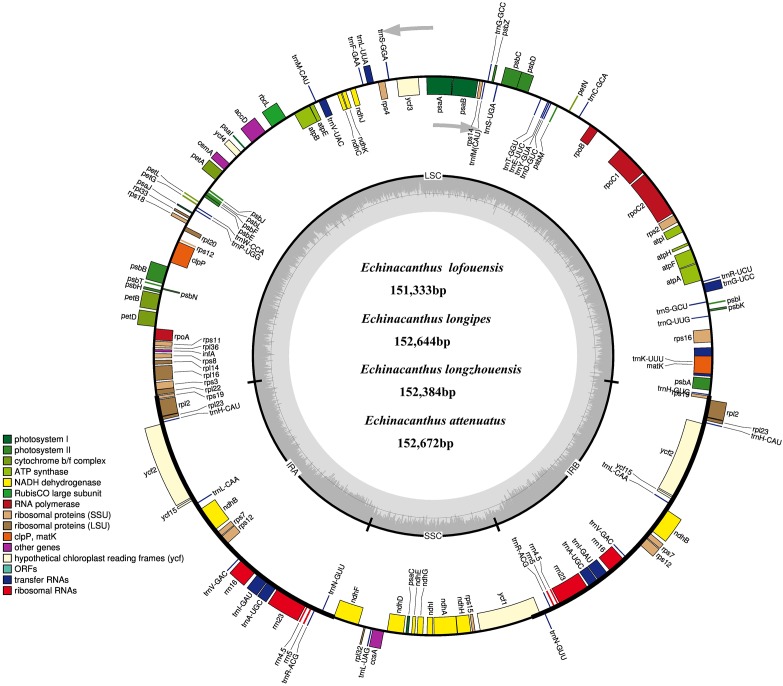
FIGURE 1.
The chloroplast genome map of four Echinacanthus species. Genes lying outside the circle are transcribed in the counter clockwise direction, while those inside are transcribed in clockwise direction. The colored bars indicted different functional group. The darker gray area in the inner circle denoted GC content while the lighter gray corresponds to the AT content of the genome. LSC, large single copy; SSC, small single copy; IR, inverted repeat.

