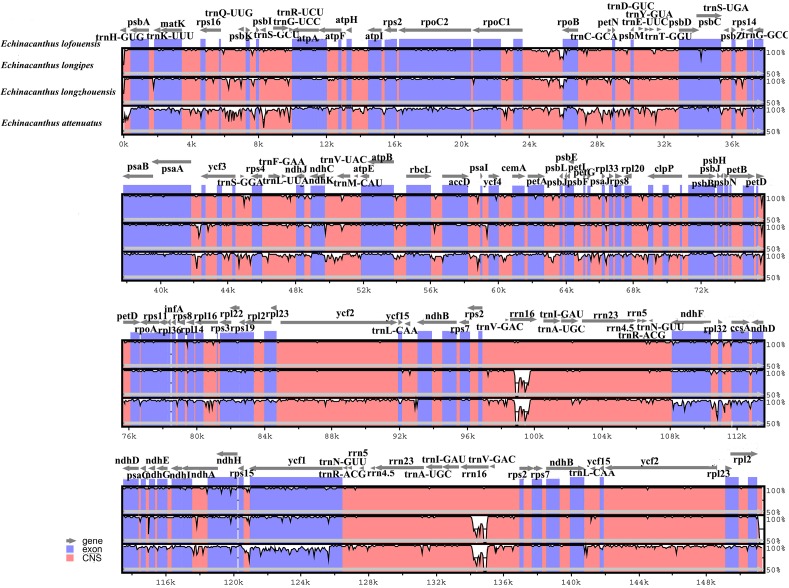
FIGURE 3.
Comparison of four Echinacanthus chloroplast genomes using mVISTA program, taking the annotation of E. lofouensis as a reference. The top line shows the genes in order. A cut-off of 70% identity was used for the plots and the Y-scale represents the percent identity between 50 and 100%. Genome regions are color-coded as exon and conserved non-coding sequences (CNS).

